Free Access
Fig. B.1
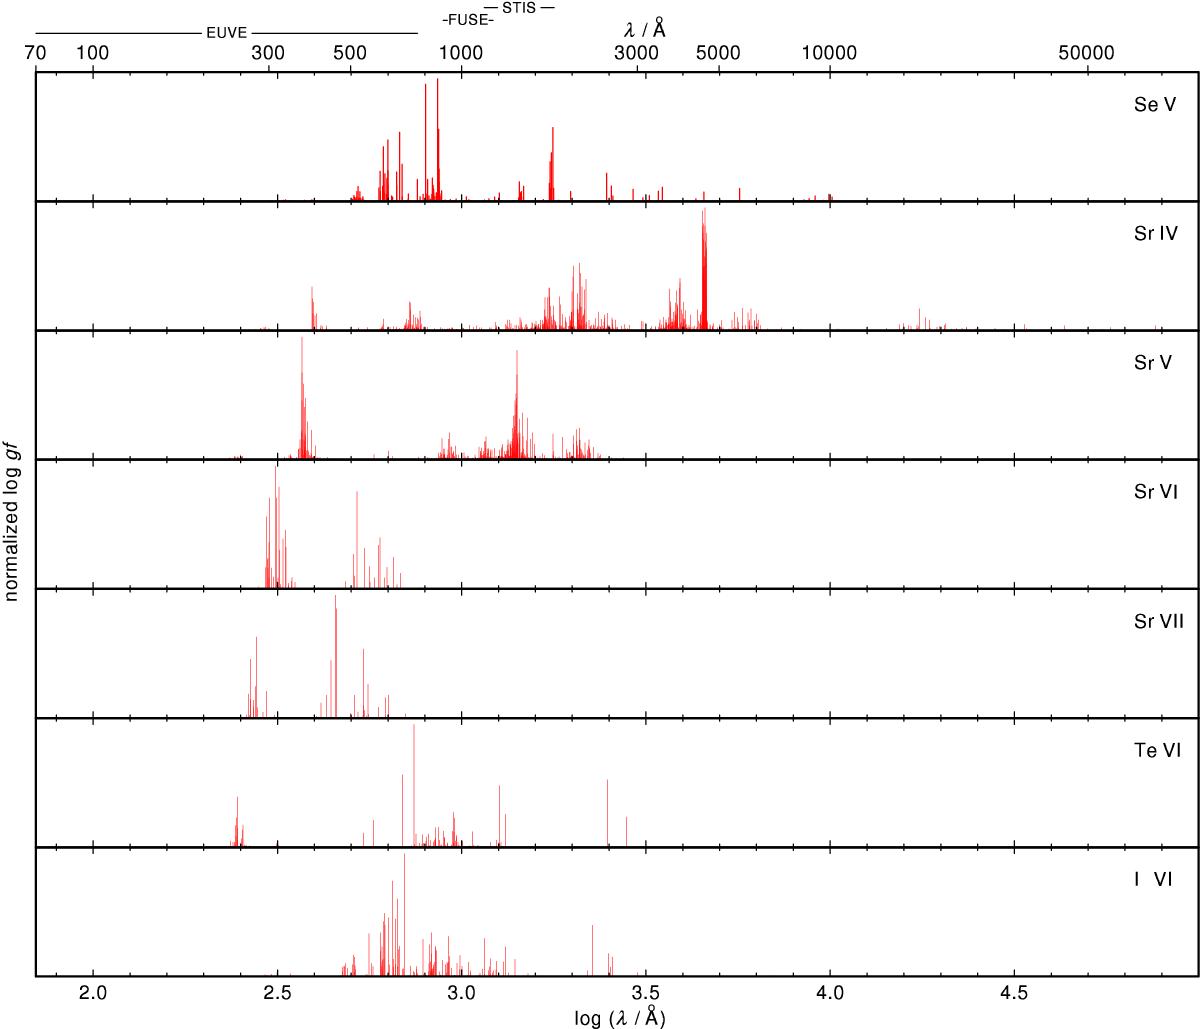
Newly calculated log gifik values of Se v, Sr iv–vii, Te vi, and I vi (from top to bottom). The log gifik values are normalized to the strongest line, matching 95% of the panels’ heights. The wavelength ranges of EUVE and of our FUSE and STIS spectra are indicated at the top.
Current usage metrics show cumulative count of Article Views (full-text article views including HTML views, PDF and ePub downloads, according to the available data) and Abstracts Views on Vision4Press platform.
Data correspond to usage on the plateform after 2015. The current usage metrics is available 48-96 hours after online publication and is updated daily on week days.
Initial download of the metrics may take a while.