Fig. 2
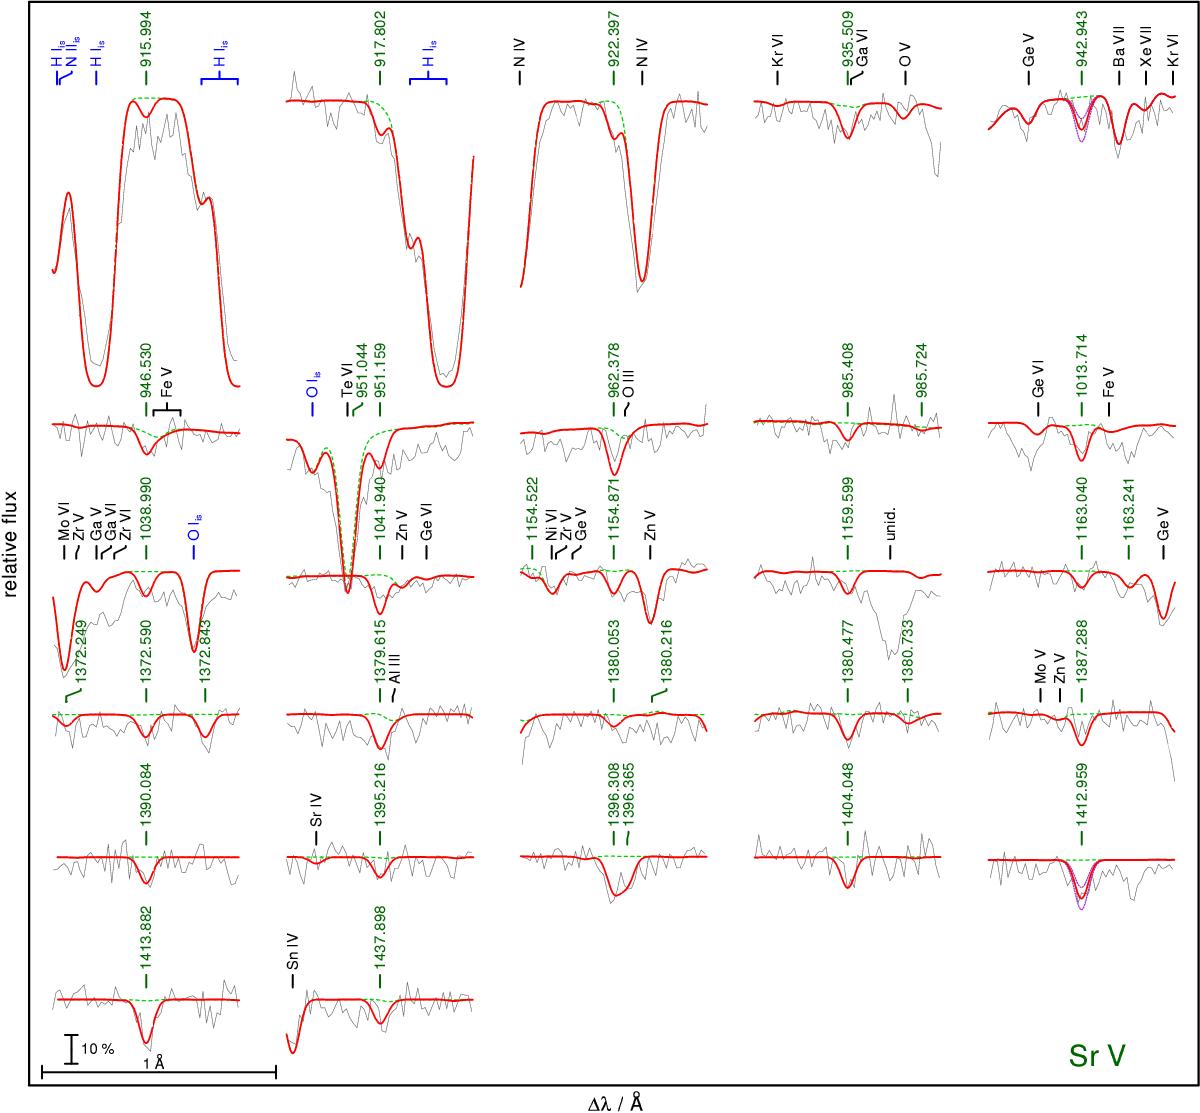
Sr v lines in the observation (gray line) of RE 0503−289, labeled with their wavelengths from Table A.17. The thick, red spectrum is calculated from our best model with a Sr mass fraction of 6.5 × 10⁻⁴. The dashed, green line shows a synthetic spectrum calculated without Sr. In cases of Sr vλ 942.943 Å and Sr vλ 1412.959 Å, the red, dashed lines show two synthetic spectra calculated with Sr abundances that were increased and decreased by 0.3 dex. The vertical bar indicates 10% of the continuum flux. Identified lines are marked. “is” denotes interstellar.
Current usage metrics show cumulative count of Article Views (full-text article views including HTML views, PDF and ePub downloads, according to the available data) and Abstracts Views on Vision4Press platform.
Data correspond to usage on the plateform after 2015. The current usage metrics is available 48-96 hours after online publication and is updated daily on week days.
Initial download of the metrics may take a while.