Fig. 3
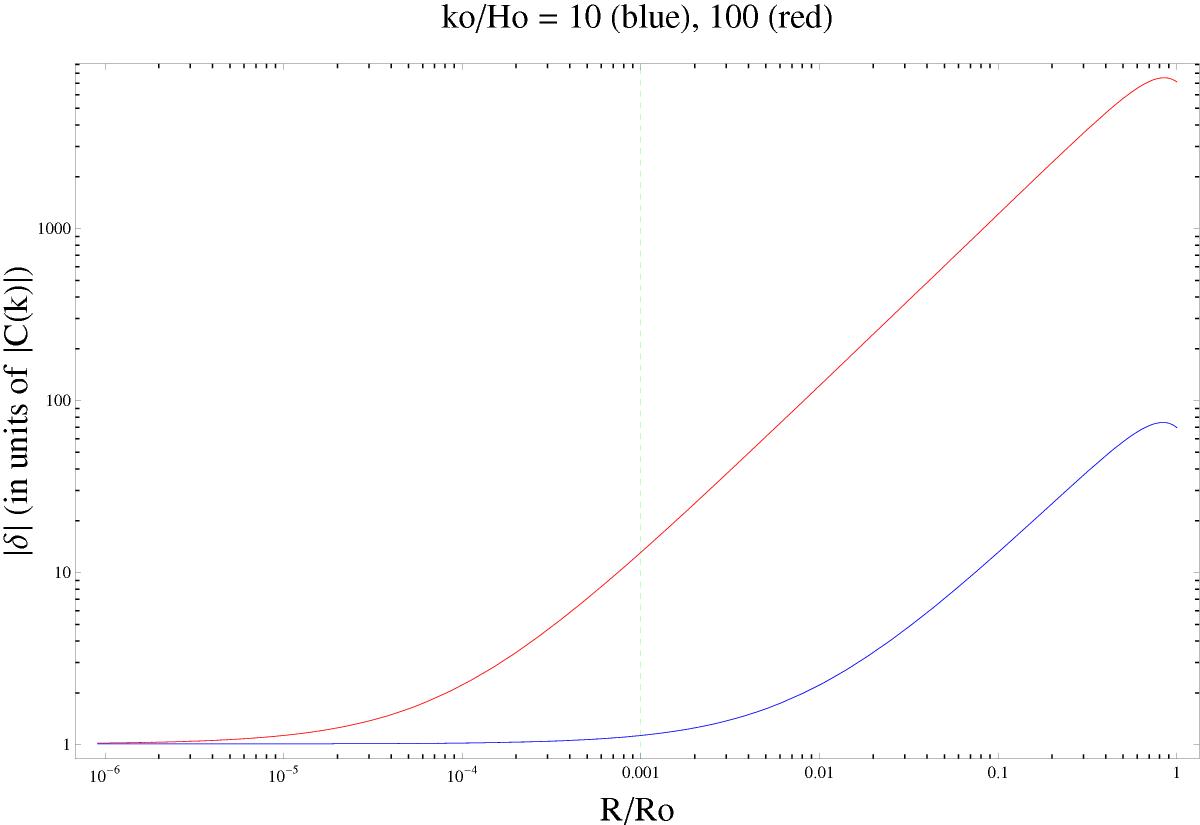
Amplitude of the rest-mass density contrast, | δ |, normalized over ![]() , as a function of the Universe scale factor, R, for
, as a function of the Universe scale factor, R, for ![]() (blue solid line), and 100 (red solid line). The vertical dashed line marks the recombination epoch. We observe that the longer the present timescale of a structure, the more suppressed the associated perturbation mode.
(blue solid line), and 100 (red solid line). The vertical dashed line marks the recombination epoch. We observe that the longer the present timescale of a structure, the more suppressed the associated perturbation mode.
Current usage metrics show cumulative count of Article Views (full-text article views including HTML views, PDF and ePub downloads, according to the available data) and Abstracts Views on Vision4Press platform.
Data correspond to usage on the plateform after 2015. The current usage metrics is available 48-96 hours after online publication and is updated daily on week days.
Initial download of the metrics may take a while.