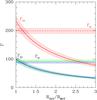
Fig. 6
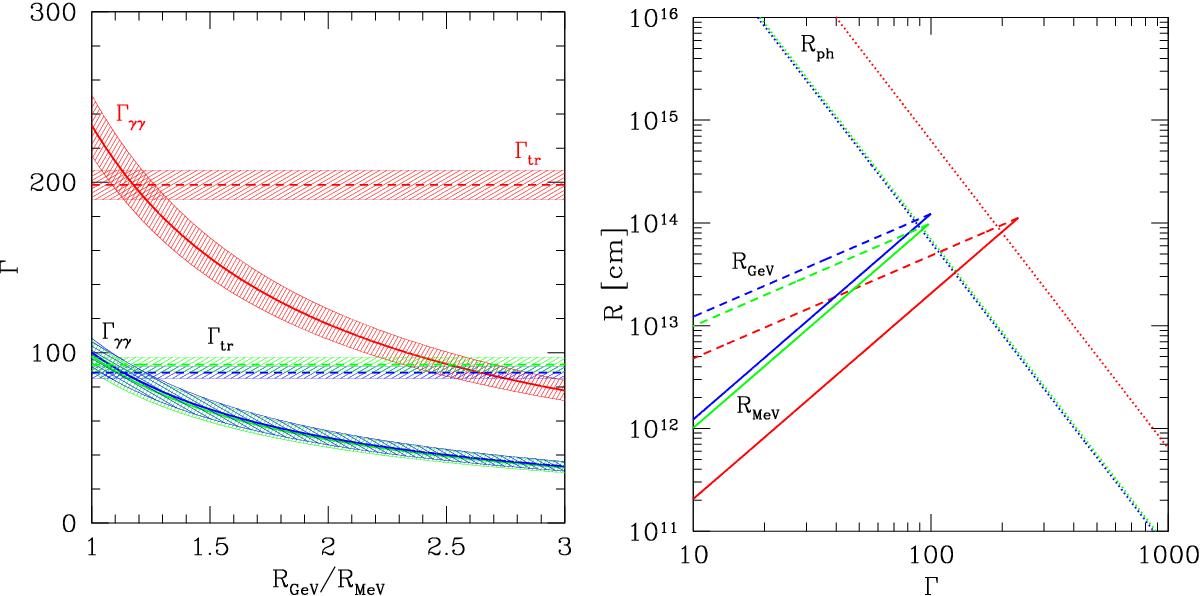
Left: Lorentz factor Γγγ for the time intervals c (red), d1 (blue), and d2 (green) as a function of the ratio of the emission radii of the GeV and MeV photons, assuming that the high-energy spectral break comes from photon opacity to pair creation (Eq. (8)). The dashed lines represent the lower limit of the Lorentz factor for transparency, Γtr (Eq. (13)). The shaded strips indicate the typical uncertainty on these quantities, obtained by propagating the errors on the measured values listed in Table 3. Right: MeV (full lines) and GeV (dashed lines) emission radii as a function of the Lorentz factor. The dotted lines correspond to the photospheric radius Rph in the different time intervals. The deceleration radius is not plotted, but we checked that it is always well above Rph, RMeV, and RGeV for normal densities in the external medium (assuming either a wind or a uniform medium).
Current usage metrics show cumulative count of Article Views (full-text article views including HTML views, PDF and ePub downloads, according to the available data) and Abstracts Views on Vision4Press platform.
Data correspond to usage on the plateform after 2015. The current usage metrics is available 48-96 hours after online publication and is updated daily on week days.
Initial download of the metrics may take a while.