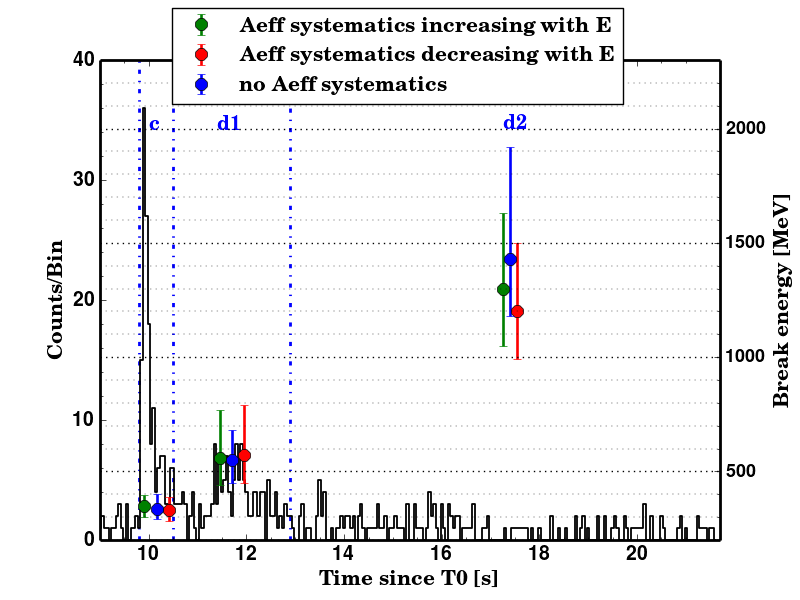
Fig. 4
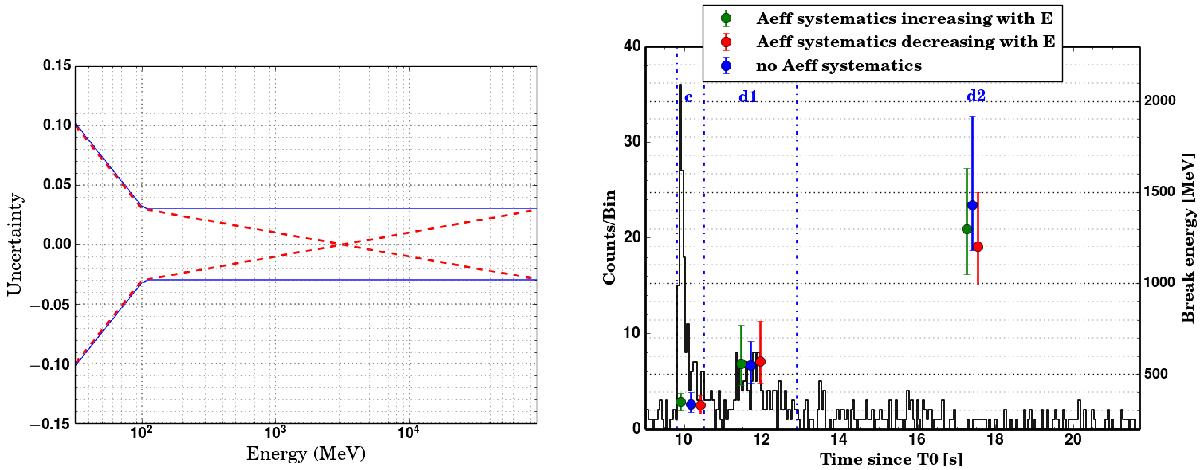
Left: containment interval of the relative systematic uncertainty on the LAT effective area (blue curves) as a function of the photon energy E, and the two ϵ(E) functions used to estimate the corresponding distortion effect on our spectral analysis (red curves). Right: folding energies for the time intervals c, d1, and d2, obtained with or without considering the systematic uncertainties on the LAT effective area. The results were superimposed onto the LAT counts light curve above 30 MeV.
Current usage metrics show cumulative count of Article Views (full-text article views including HTML views, PDF and ePub downloads, according to the available data) and Abstracts Views on Vision4Press platform.
Data correspond to usage on the plateform after 2015. The current usage metrics is available 48-96 hours after online publication and is updated daily on week days.
Initial download of the metrics may take a while.