Fig. 3
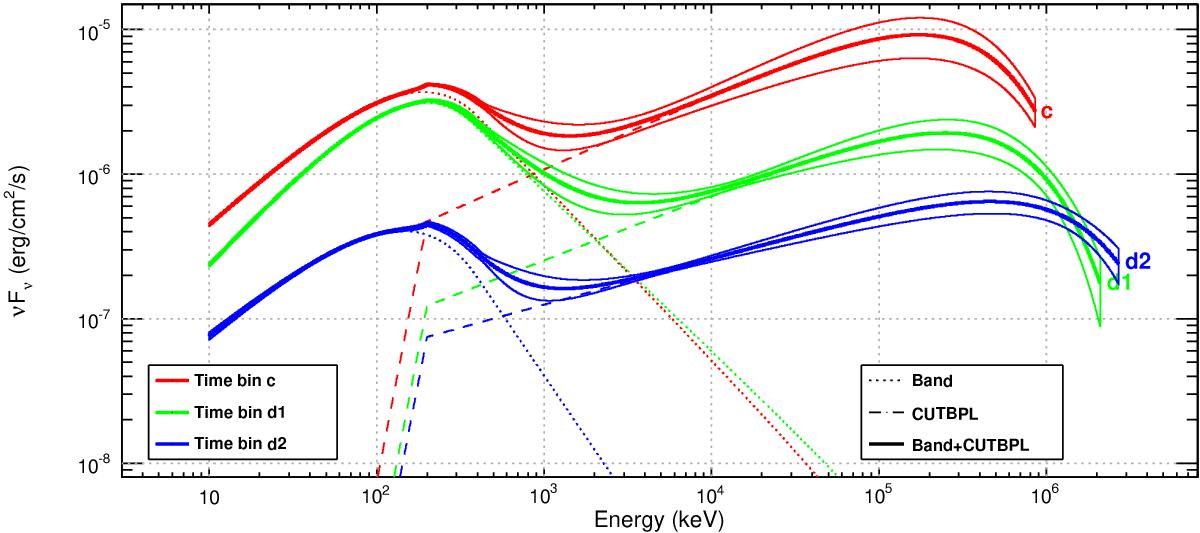
GRB 090926A spectral energy distributions as measured by the Fermi GBM and LAT in time intervals c (red curves), d1 (green curves), and d2 (blue curves) with LAT Pass 8 data above 30 MeV. Each solid curve represents the best-fitted spectral shape (Band+CUTBPL) within a 68% confidence level contour derived from the errors on the fit parameters.
Current usage metrics show cumulative count of Article Views (full-text article views including HTML views, PDF and ePub downloads, according to the available data) and Abstracts Views on Vision4Press platform.
Data correspond to usage on the plateform after 2015. The current usage metrics is available 48-96 hours after online publication and is updated daily on week days.
Initial download of the metrics may take a while.