Fig. 2
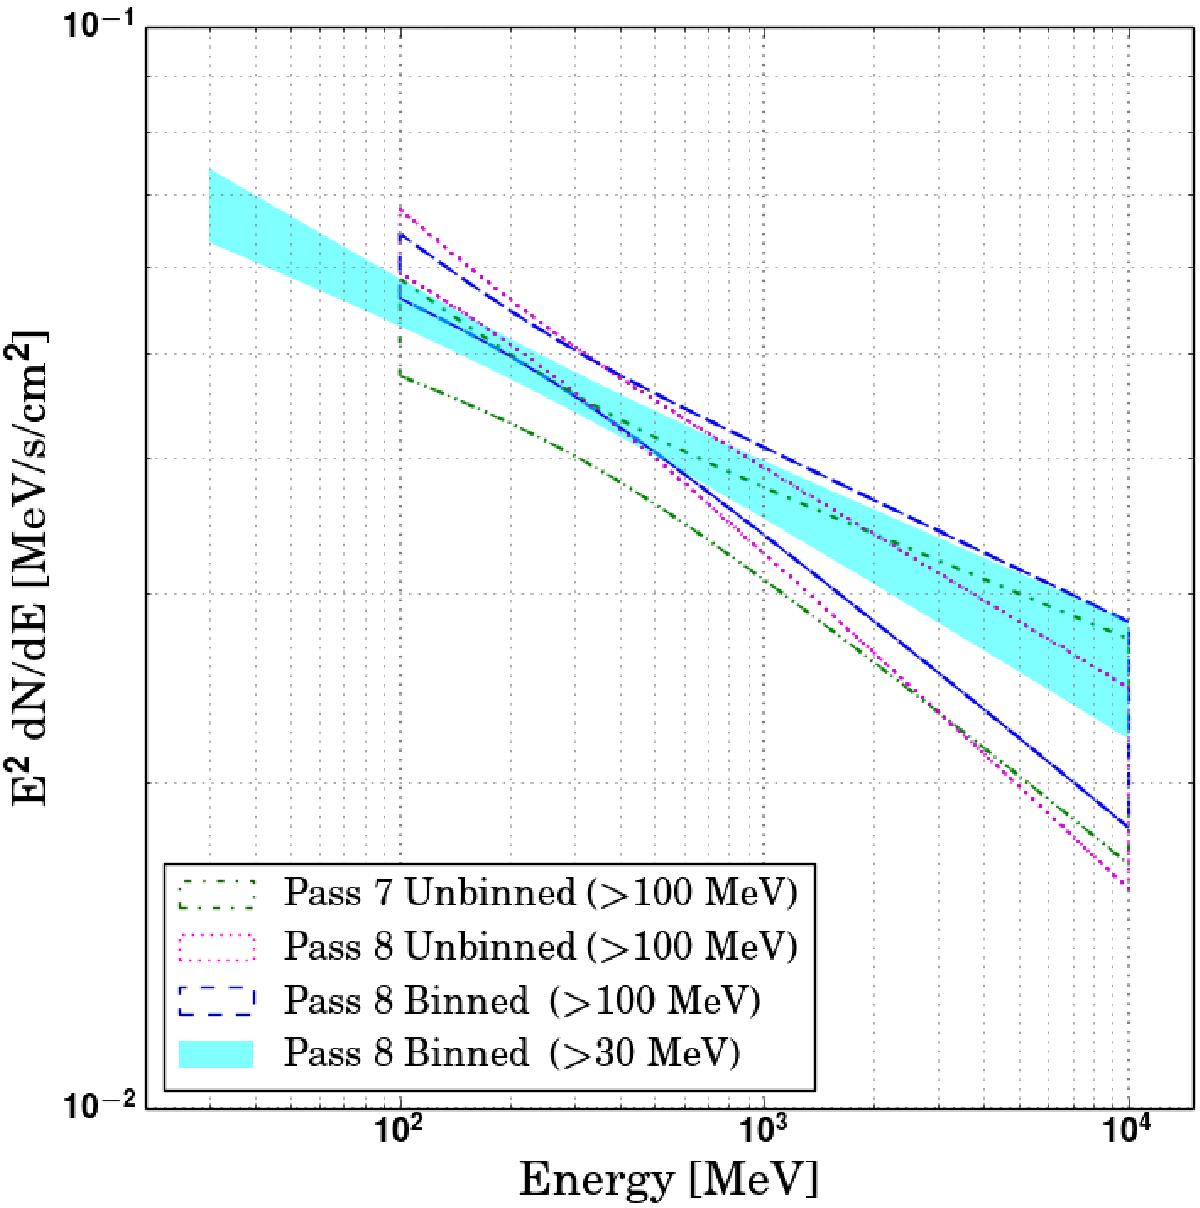
GRB 090926A time-averaged spectral energy distribution as measured by the Fermi/LAT, using Pass 7 data above 100 MeV (dot-dashed butterfly) and Pass 8 data above 30 MeV (filled butterfly) or 100 MeV (dotted and dashed butterflies). Each spectrum is represented by a 68% confidence level contour derived from the errors on the parameters of the fitted power-law function.
Current usage metrics show cumulative count of Article Views (full-text article views including HTML views, PDF and ePub downloads, according to the available data) and Abstracts Views on Vision4Press platform.
Data correspond to usage on the plateform after 2015. The current usage metrics is available 48-96 hours after online publication and is updated daily on week days.
Initial download of the metrics may take a while.