Fig. 1
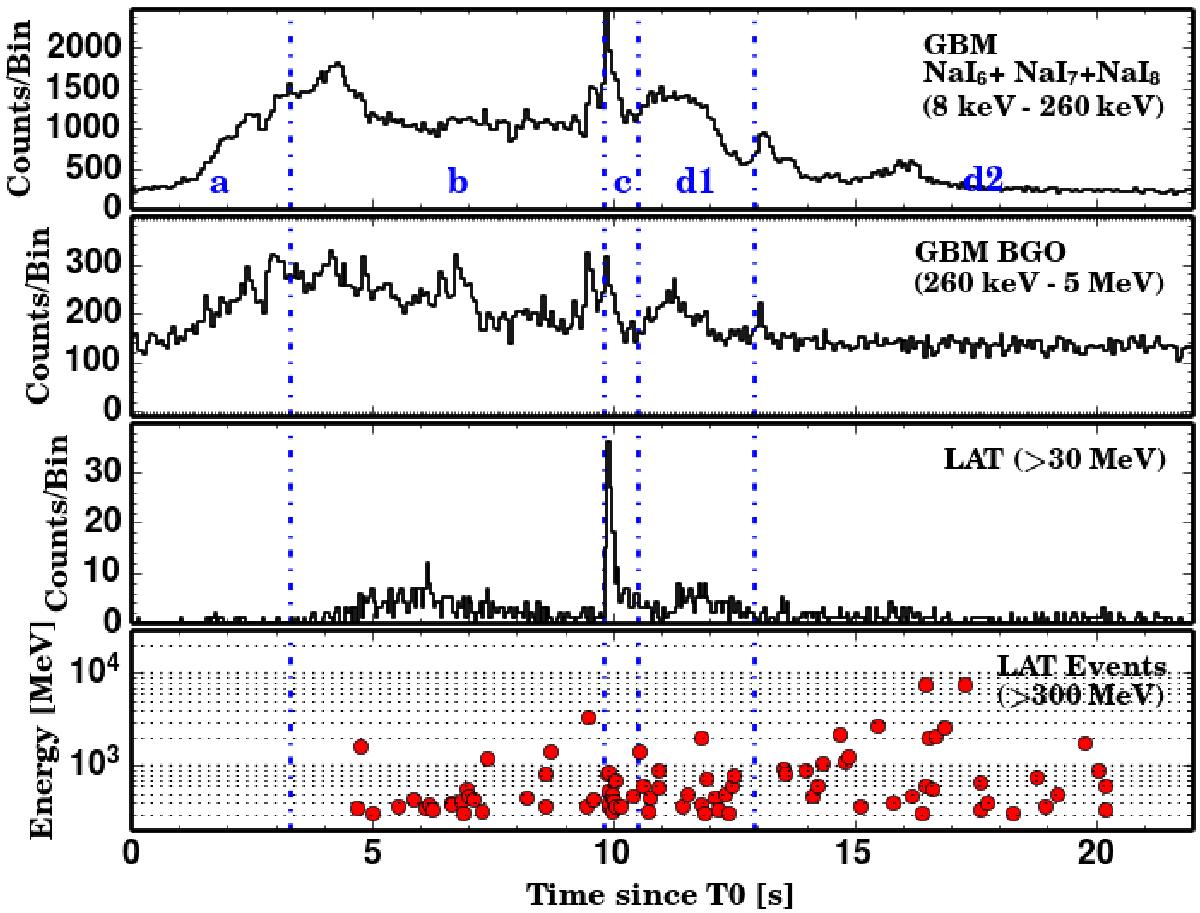
GRB 090926A counts light curves as measured by the GBM and LAT, from lowest to highest energies. The sum of the counts in the GBM NaI detectors (first panel), in the GBM BGO detector facing the burst (second panel), and using the LAT Pass 8 transient-class events above 30 MeV within a 12° region of interest (third panel). The last panel shows the energies of the events from this sample, which have been detected above 300 MeV. The dashed blue vertical lines indicate the time intervals that are used for the joint GBM and LAT spectral analyses.
Current usage metrics show cumulative count of Article Views (full-text article views including HTML views, PDF and ePub downloads, according to the available data) and Abstracts Views on Vision4Press platform.
Data correspond to usage on the plateform after 2015. The current usage metrics is available 48-96 hours after online publication and is updated daily on week days.
Initial download of the metrics may take a while.