Free Access
Fig. 9
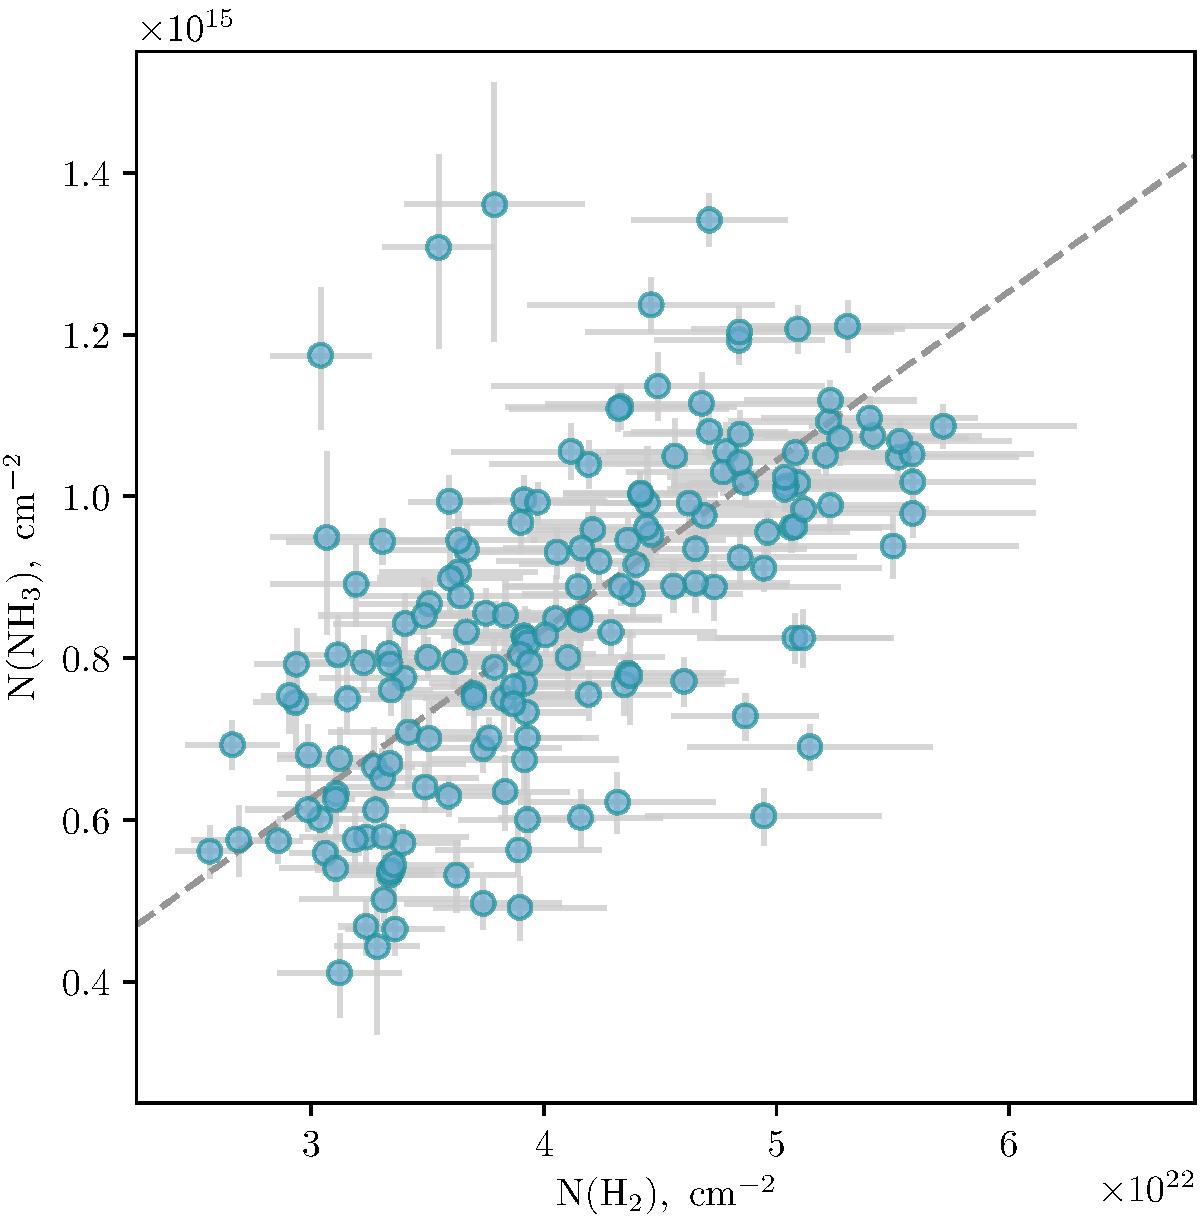
Herschel-derived H2 gas column density plotted against fitted NH3 column density. The dashed straight line passes through both the mean ammonia abundance in the IRDC and through the zero column density point.
Current usage metrics show cumulative count of Article Views (full-text article views including HTML views, PDF and ePub downloads, according to the available data) and Abstracts Views on Vision4Press platform.
Data correspond to usage on the plateform after 2015. The current usage metrics is available 48-96 hours after online publication and is updated daily on week days.
Initial download of the metrics may take a while.