Free Access
Fig. 4
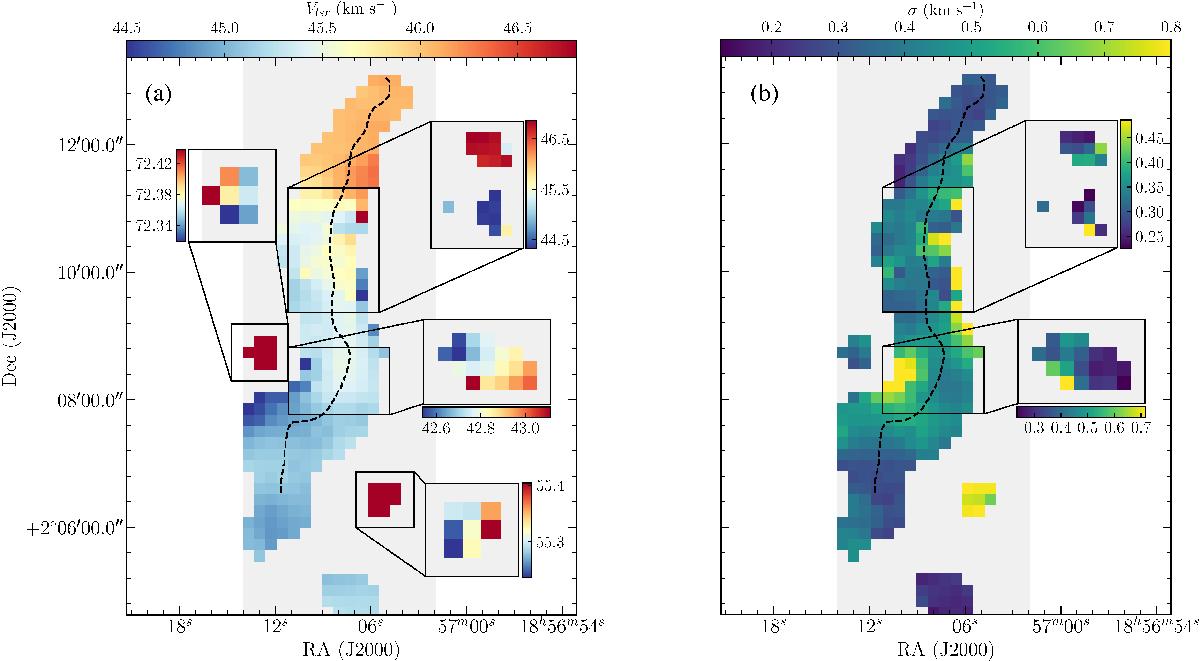
Panel a: Fitted velocities relative to line rest frequency. Overlaid on the main velocity component, additional components, enclosed in the black contours, are shown in the cut-outs. The ridge of G035.39, as defined in Sect. 2.1, is marked as a dashed black line. Panel b: Same as a, but for the fitted velocity dispersions.
Current usage metrics show cumulative count of Article Views (full-text article views including HTML views, PDF and ePub downloads, according to the available data) and Abstracts Views on Vision4Press platform.
Data correspond to usage on the plateform after 2015. The current usage metrics is available 48-96 hours after online publication and is updated daily on week days.
Initial download of the metrics may take a while.