Fig. 10
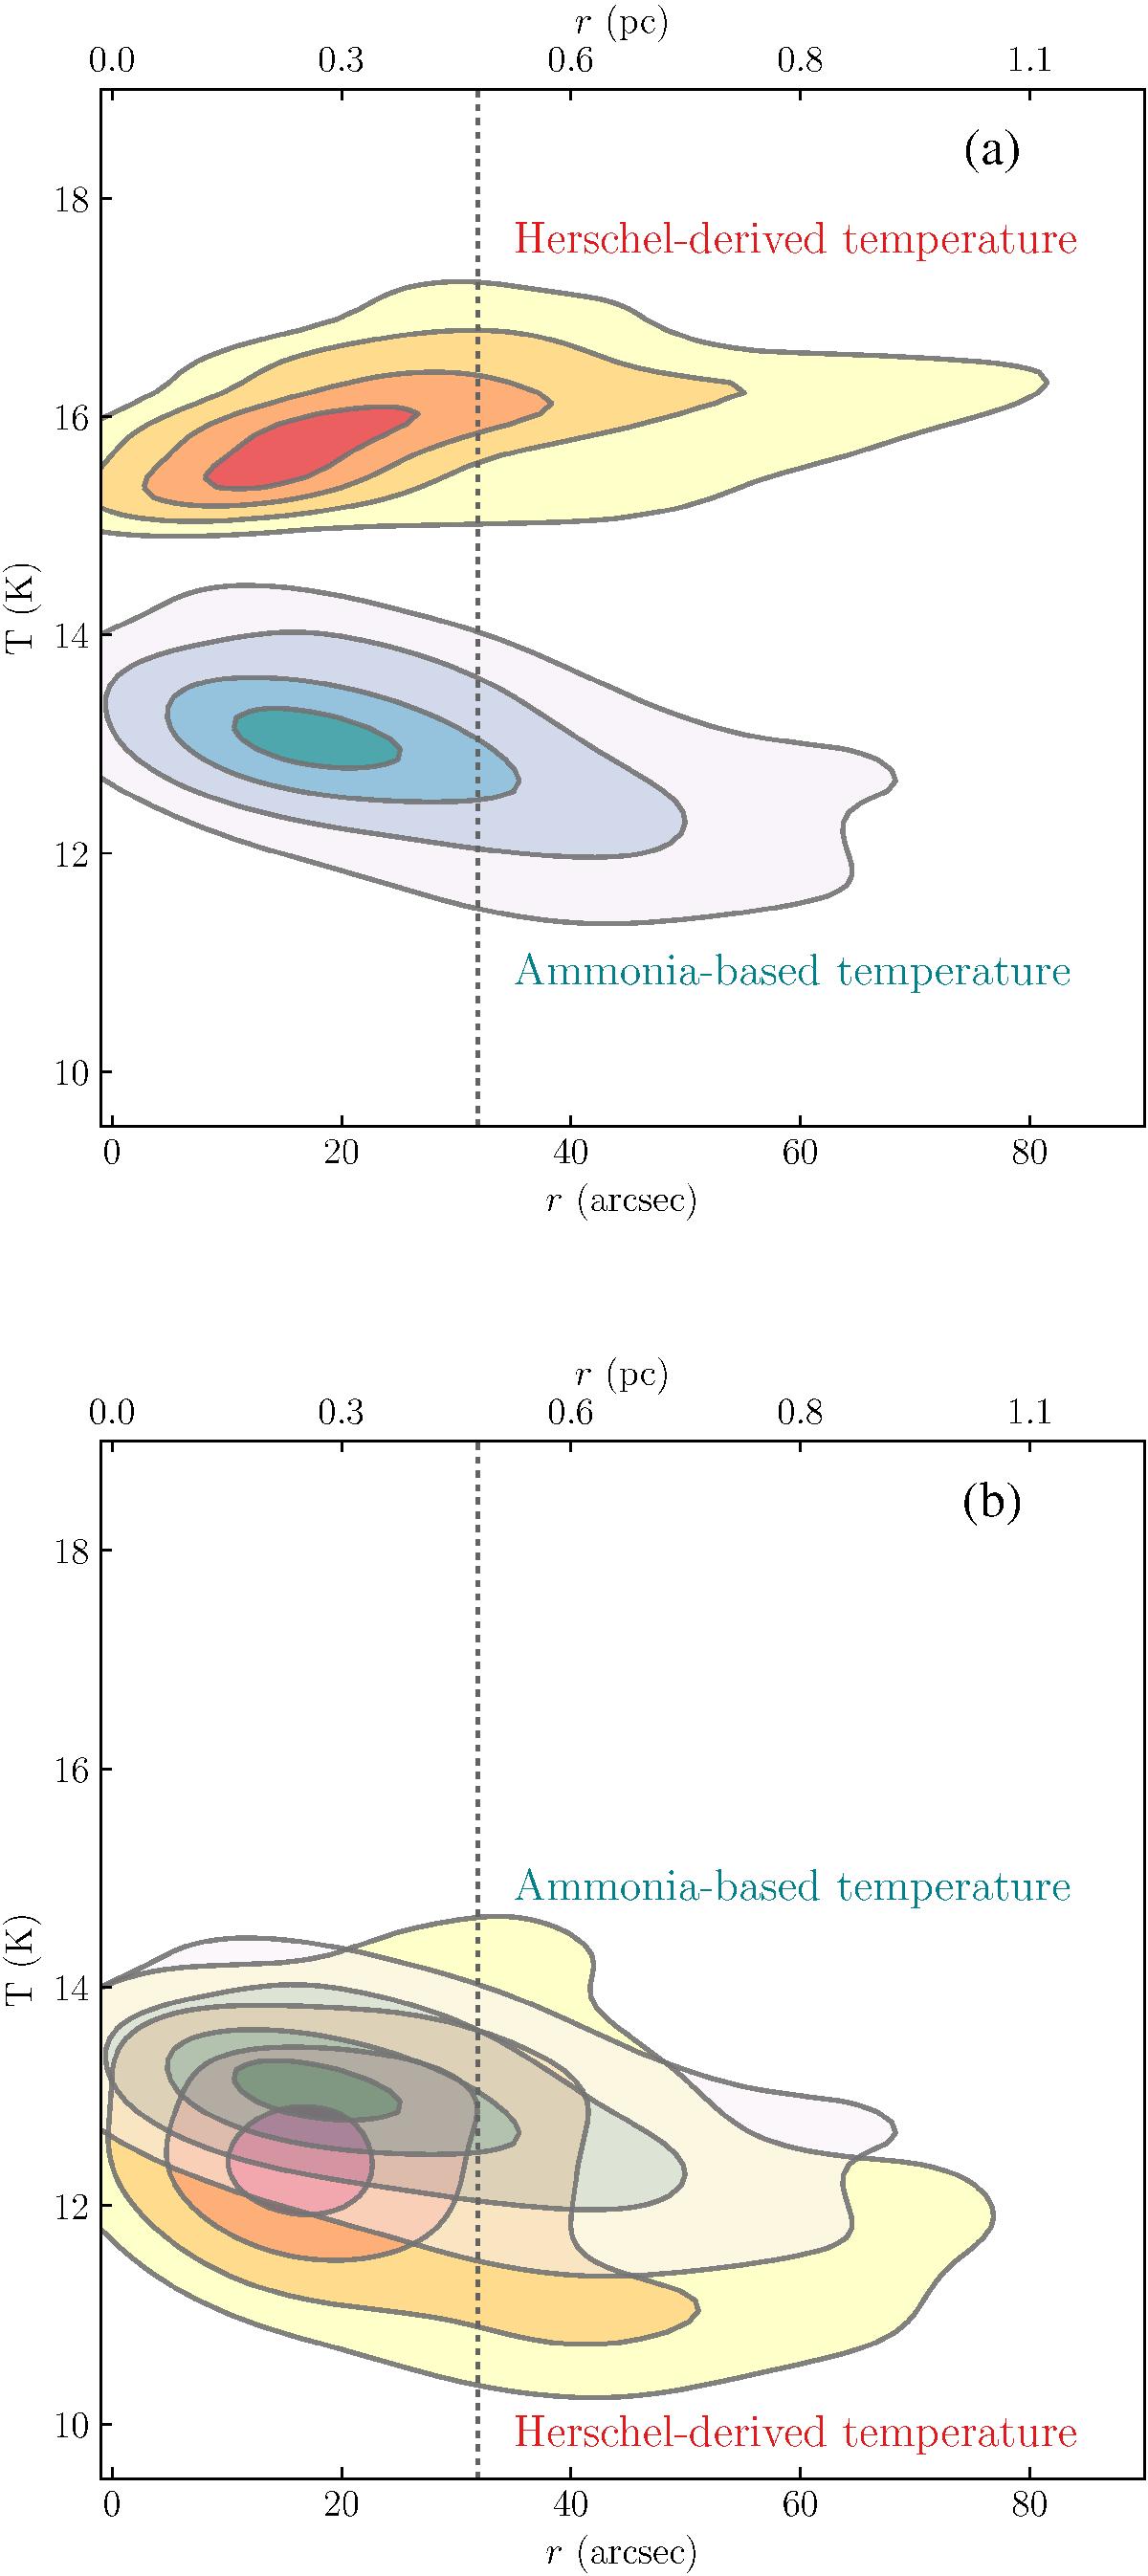
Panel a: Fitted temperatures as a function of distance from the closest massive dense core. The contour overlays show varying levels of kernel density estimation of dust (in red) and gas (in blue) temperatures. The contour σ-levels are equivalent to that of a bivariate normal distribution, starting at 0.5σ and progressing outwards in steps of 0.5σ. The vertical dashed line indicates the beam size of the GBT. Panel b: Same as panel a, but for the dust temperatures derived via the Galactic Gaussian (GG) method.
Current usage metrics show cumulative count of Article Views (full-text article views including HTML views, PDF and ePub downloads, according to the available data) and Abstracts Views on Vision4Press platform.
Data correspond to usage on the plateform after 2015. The current usage metrics is available 48-96 hours after online publication and is updated daily on week days.
Initial download of the metrics may take a while.