Fig. 1
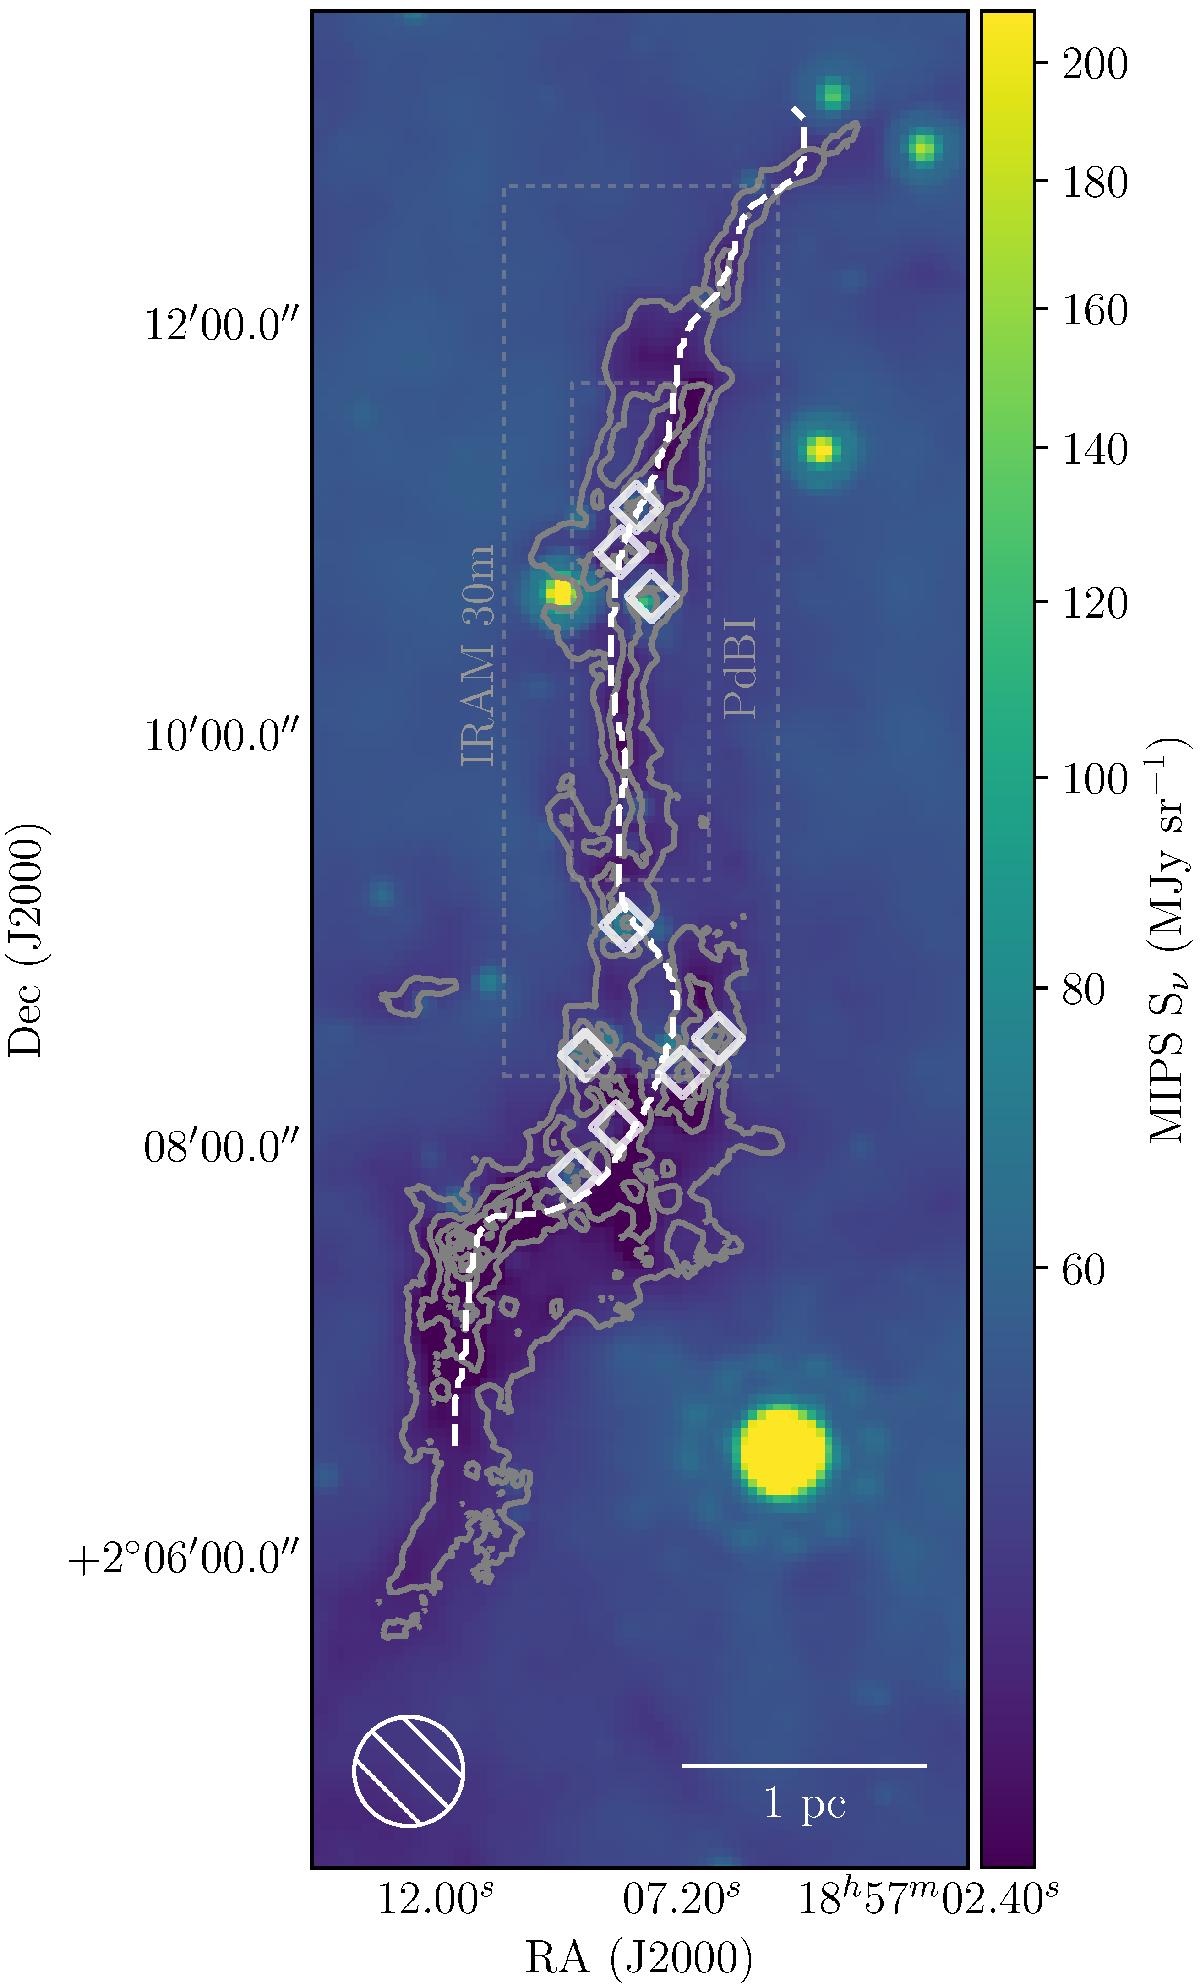
MIPS 24 μm emission overlaid with infrared extinction contours (Kainulainen & Tan 2013) starting from AV = 25 mag and progressing inwards in steps of 20 mag. Massive dense Herschel cores from Nguyen Luong et al. (2011) are marked with white diamonds. The white dashed line indicates the peak intensity ridge of NH3 (1, 1) emission (see Sect. 2.1). The dashed gray rectangles illustrate the extent of IRAM 30 m (outer box) and PdBI (inner box) N2H+ maps (Henshaw et al. 2013, 2014), while the extent of the whole figure corresponds to the area mapped with the GBT.
Current usage metrics show cumulative count of Article Views (full-text article views including HTML views, PDF and ePub downloads, according to the available data) and Abstracts Views on Vision4Press platform.
Data correspond to usage on the plateform after 2015. The current usage metrics is available 48-96 hours after online publication and is updated daily on week days.
Initial download of the metrics may take a while.