Fig. 7
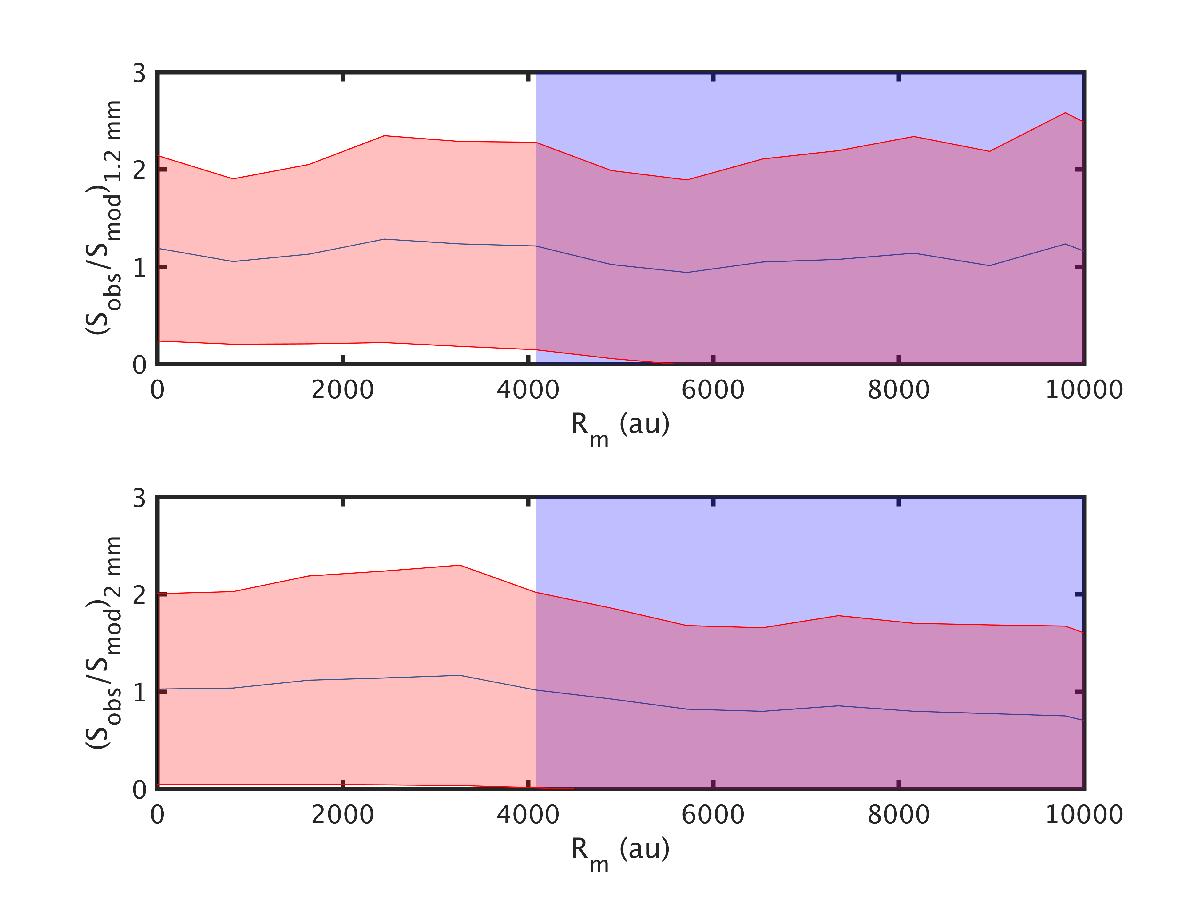
Ratio between the observed and the modeled surface brightnesses at 1.2 mm (top) and 2 mm (bottom) as a function of geometric mean radius of the ellipses in Fig. 6, using the temperature and density profiles from Keto et al. (2015) and an opacity value of κ250 μm = 0.2 ± 0.1 cm2 g-1 and β = 2.3 ± 0.4. The shadowed red region represents the uncertainties on the fluxes, the opacity, and the spectral index. The shaded blue region indicates the zone where the observed surface brightness is below 3σ.
Current usage metrics show cumulative count of Article Views (full-text article views including HTML views, PDF and ePub downloads, according to the available data) and Abstracts Views on Vision4Press platform.
Data correspond to usage on the plateform after 2015. The current usage metrics is available 48-96 hours after online publication and is updated daily on week days.
Initial download of the metrics may take a while.