Fig. 5
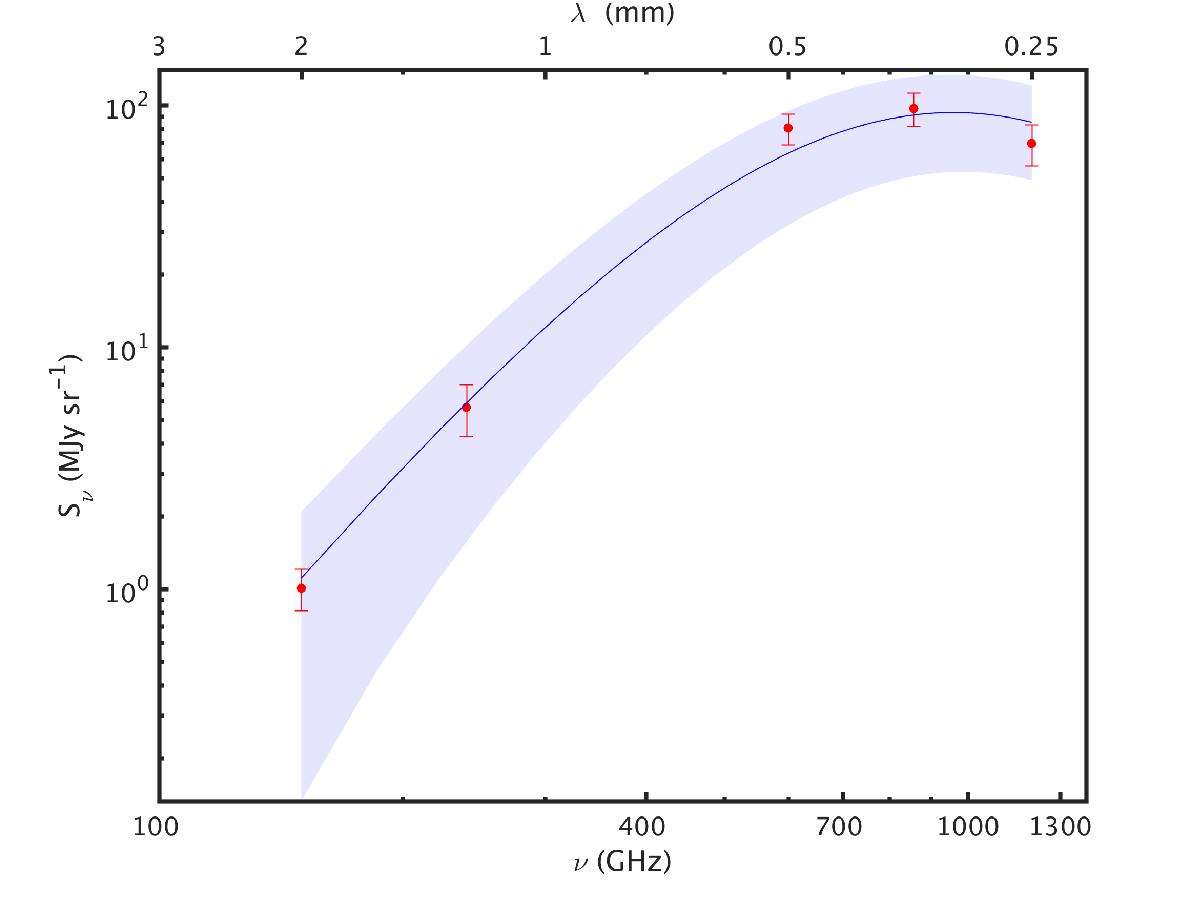
Fit of the SED to the five spectral windows available at 250, 350, 500, 1250, and 2000 μm at the peak emission when convolving and regridding all windows to the resolution of the 500 μm band. The error bars indicate the weights used in the fitting, which correspond to the uncertainties and noise associated with the data. The shadowed blue region show the 95% confidence intervals of the fitted parameters.
Current usage metrics show cumulative count of Article Views (full-text article views including HTML views, PDF and ePub downloads, according to the available data) and Abstracts Views on Vision4Press platform.
Data correspond to usage on the plateform after 2015. The current usage metrics is available 48-96 hours after online publication and is updated daily on week days.
Initial download of the metrics may take a while.