Fig. 2
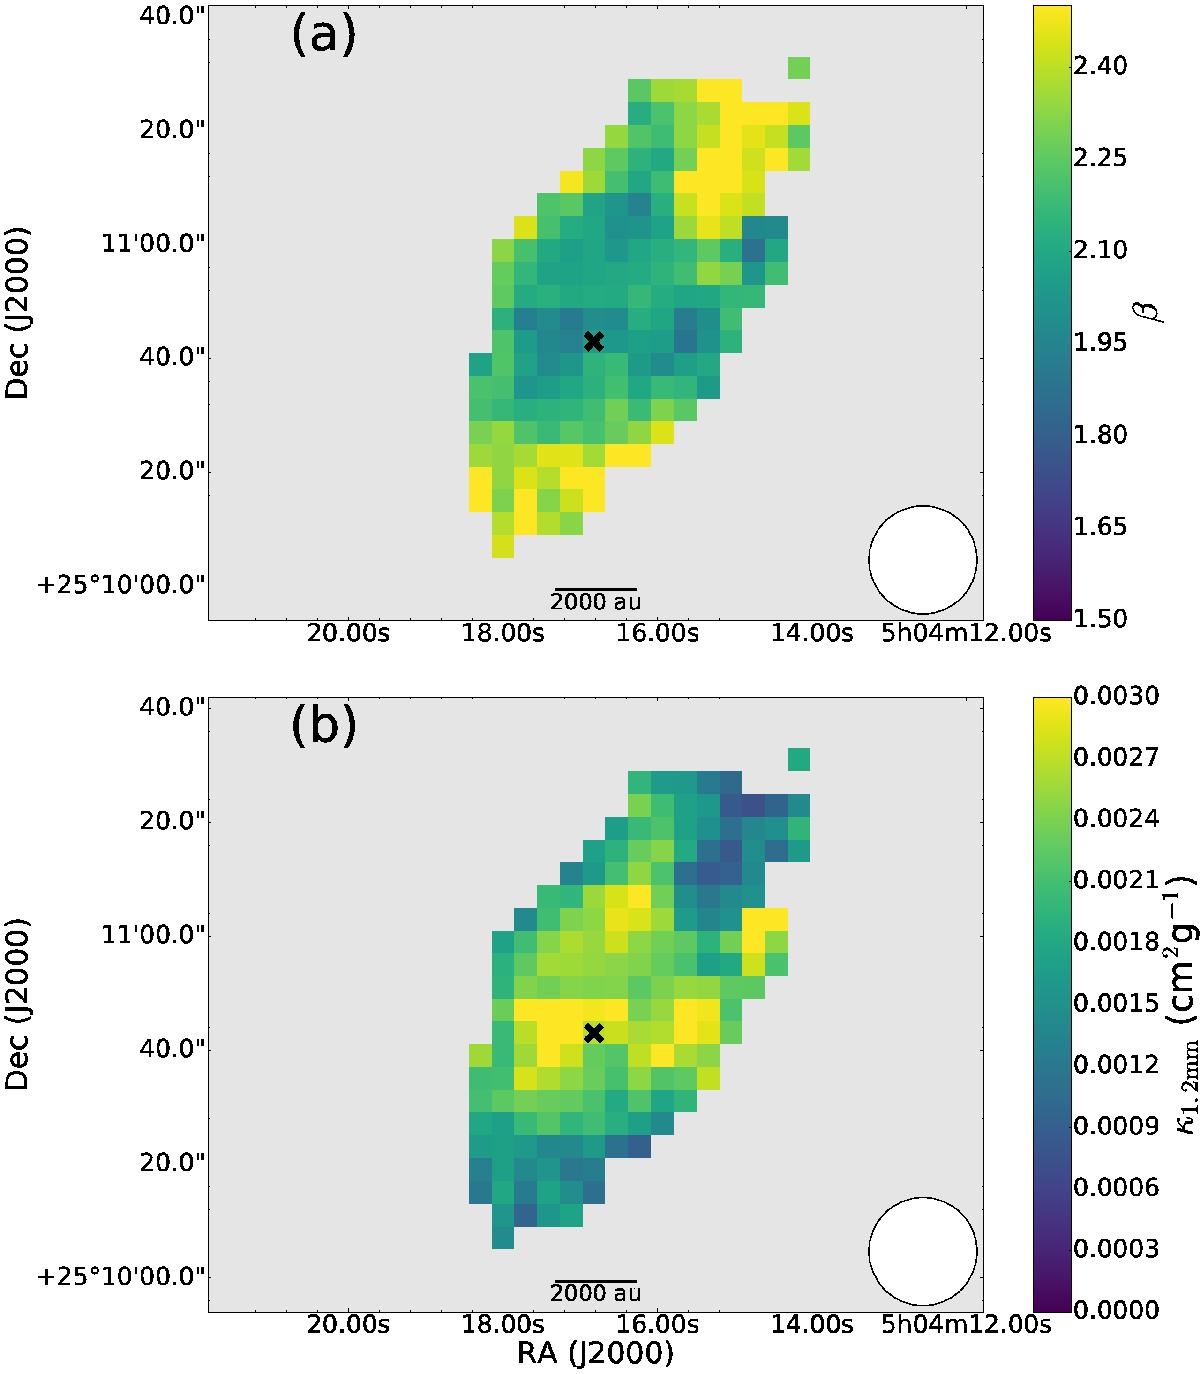
Maps of the a) spectral index and b) opacity at 1.2 mm assuming a constant core temperature of 10 K and a constant κ250 μm = 0.1 cm2 g-1 value (Hildebrand 1983). The 1.2 mm map was convolved to the 2 mm band resolution, which is 19′′ (HPBW shown by the white circle in the bottom right corner). In both cases, the crosses mark the peak of the emission corresponding to the final 1.2 mm map convolved to 19′′.
Current usage metrics show cumulative count of Article Views (full-text article views including HTML views, PDF and ePub downloads, according to the available data) and Abstracts Views on Vision4Press platform.
Data correspond to usage on the plateform after 2015. The current usage metrics is available 48-96 hours after online publication and is updated daily on week days.
Initial download of the metrics may take a while.