Free Access
Fig. A.4
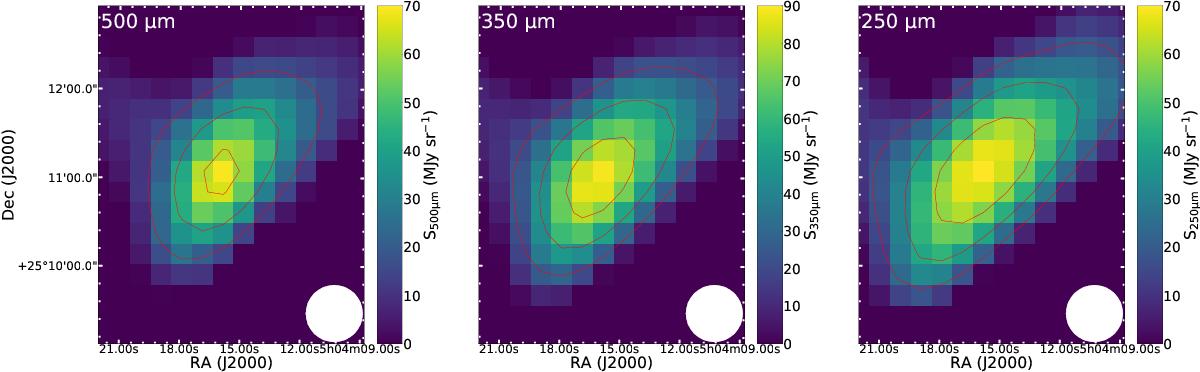
Resulting Herschel/SPIRE maps after applying the filtering method used in this work, extracting the emission around the core where no emission is detected in mm wavelengths. The contours represent steps of 25% of the peak emission at each band.
Current usage metrics show cumulative count of Article Views (full-text article views including HTML views, PDF and ePub downloads, according to the available data) and Abstracts Views on Vision4Press platform.
Data correspond to usage on the plateform after 2015. The current usage metrics is available 48-96 hours after online publication and is updated daily on week days.
Initial download of the metrics may take a while.