Fig. A.2
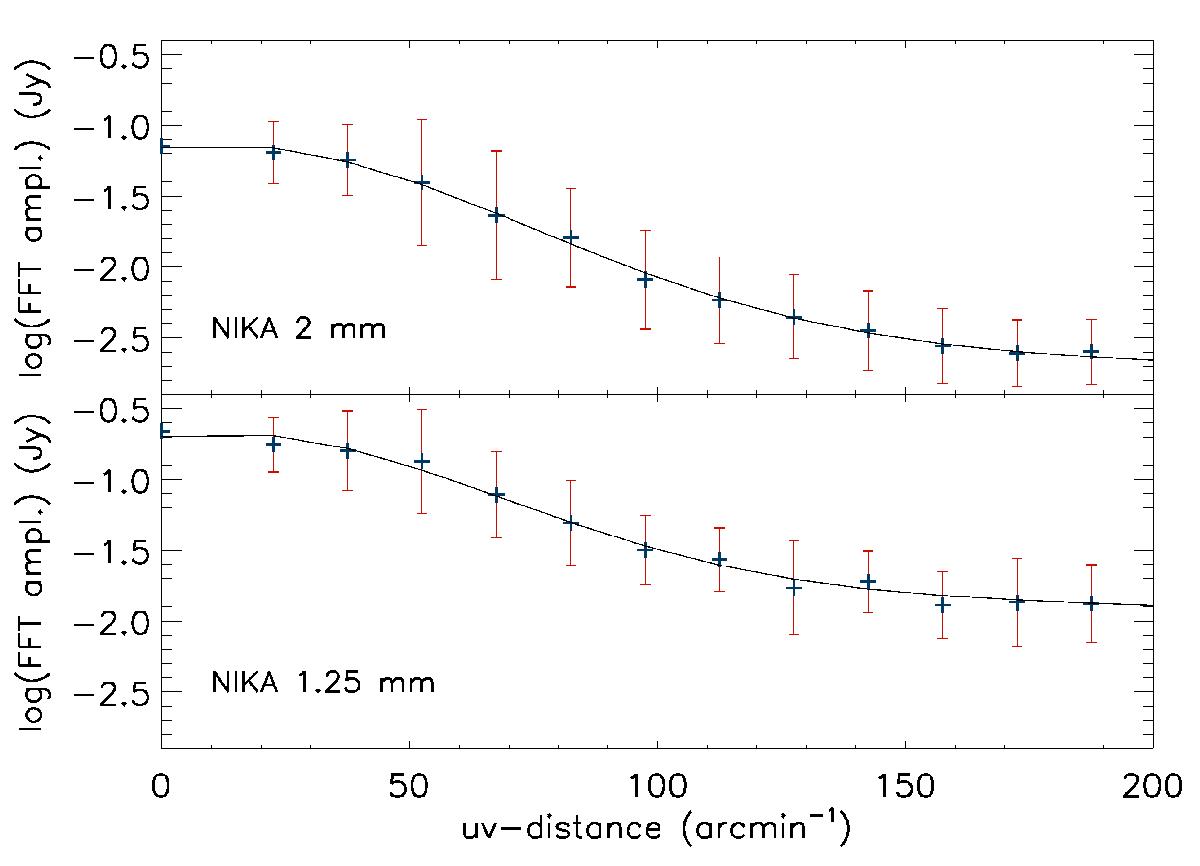
Fourier amplitude profiles of the 1.2 mm (top) and 2 mm (bottom) data in the frequency domain. The profiles are obtained by averaging in rings of 1 pixel in width at different distances from the center of the Fourier transformed emission maps. The profile at 2 mm is used to derive a mask, which is applied to the Herschel/SPIRE data in order to filter out the large-scale emission.
Current usage metrics show cumulative count of Article Views (full-text article views including HTML views, PDF and ePub downloads, according to the available data) and Abstracts Views on Vision4Press platform.
Data correspond to usage on the plateform after 2015. The current usage metrics is available 48-96 hours after online publication and is updated daily on week days.
Initial download of the metrics may take a while.