Free Access
Fig. 10
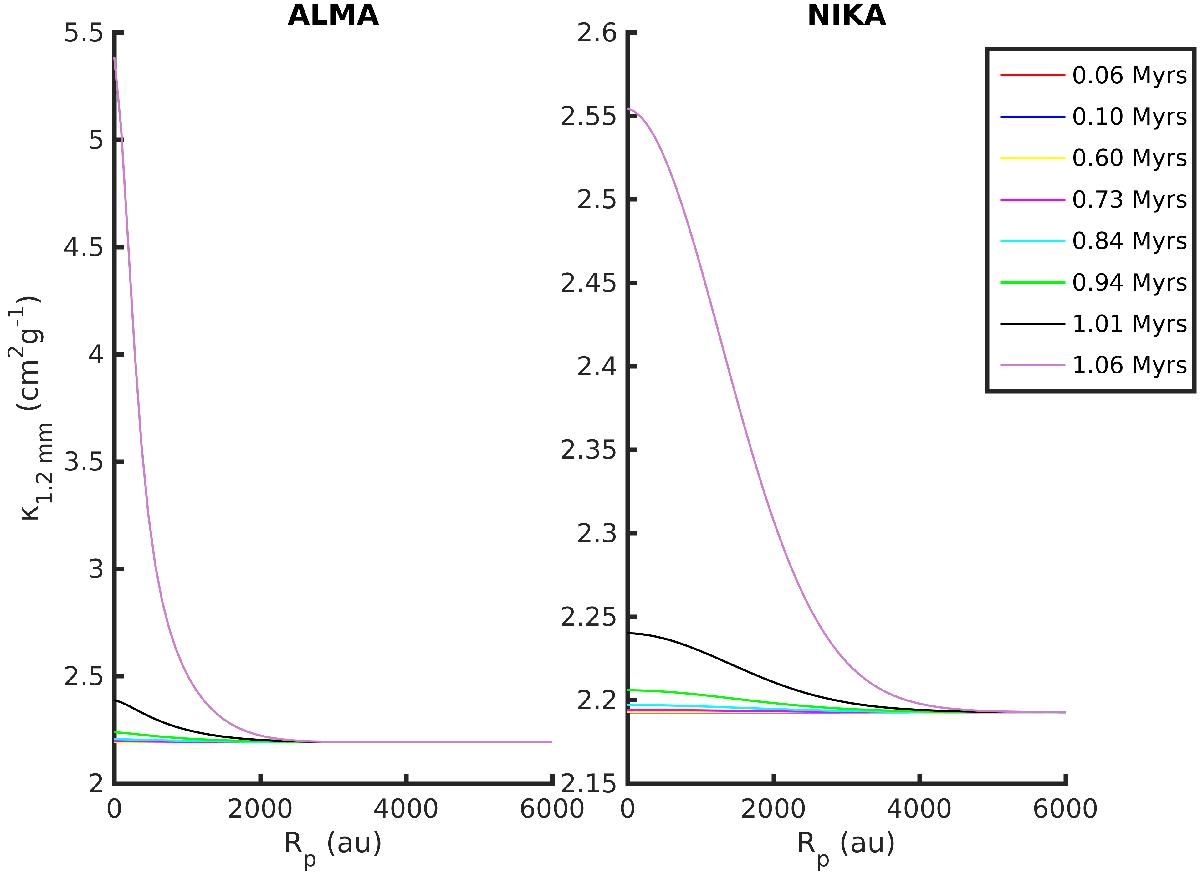
Opacity variation with time and projected radius deduced with ALMA (left) and NIKA (right) simulated observations for the case of a dynamical cloud. The change in the opacity between the center and the outer edge for the case of NIKA is less than 15%, while for ALMA it is a factor of ~2.5 after 1.06 Myr of evolution.
Current usage metrics show cumulative count of Article Views (full-text article views including HTML views, PDF and ePub downloads, according to the available data) and Abstracts Views on Vision4Press platform.
Data correspond to usage on the plateform after 2015. The current usage metrics is available 48-96 hours after online publication and is updated daily on week days.
Initial download of the metrics may take a while.