Fig. 4
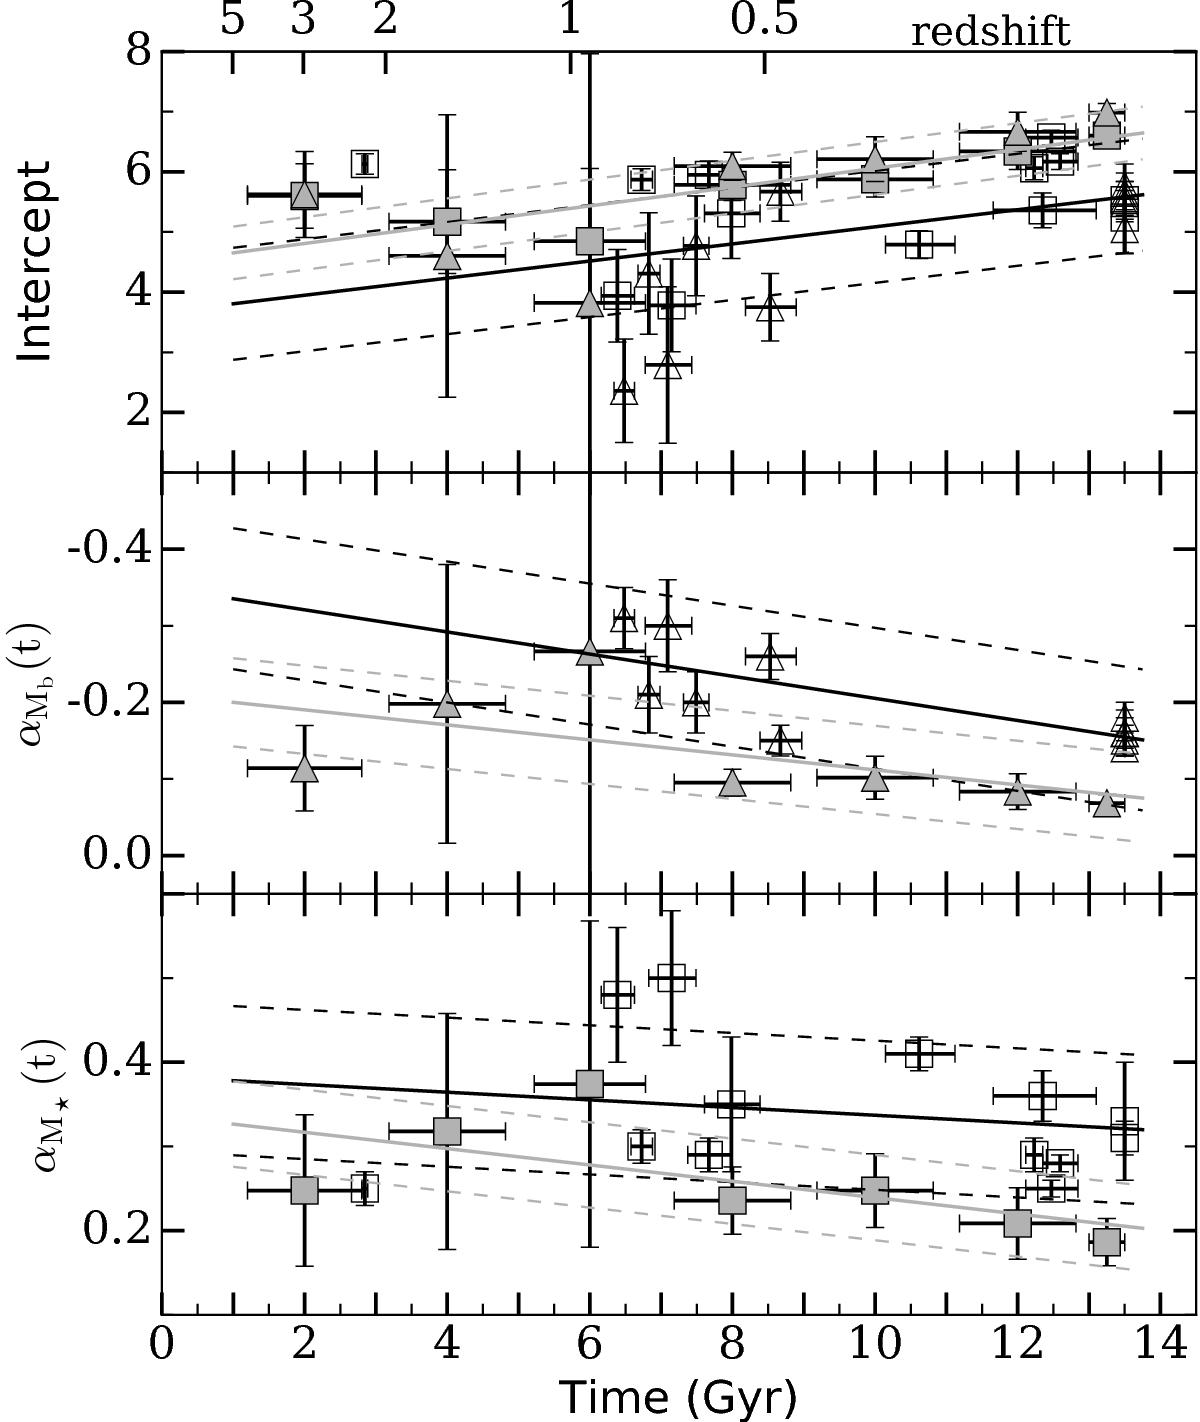
Intercept (upper panel), slope of the luminosity-metallicity (middle panel), and slope of the mass-metallicity relation (lower panel) as a function of time. The open symbols show results using gas-phase metallicities from literature. The filled symbols show data from LCID dwarfs. The data obtained from MB magnitudes are shown as triangles. The squares show results from stellar masses. The linear fits to the results are overplotted. The dashed lines show the uncertainties of the fit in each case. The vertical axis of the middle panel has been inverted to represent the same behavior as the others panels.
Current usage metrics show cumulative count of Article Views (full-text article views including HTML views, PDF and ePub downloads, according to the available data) and Abstracts Views on Vision4Press platform.
Data correspond to usage on the plateform after 2015. The current usage metrics is available 48-96 hours after online publication and is updated daily on week days.
Initial download of the metrics may take a while.