Fig. 2
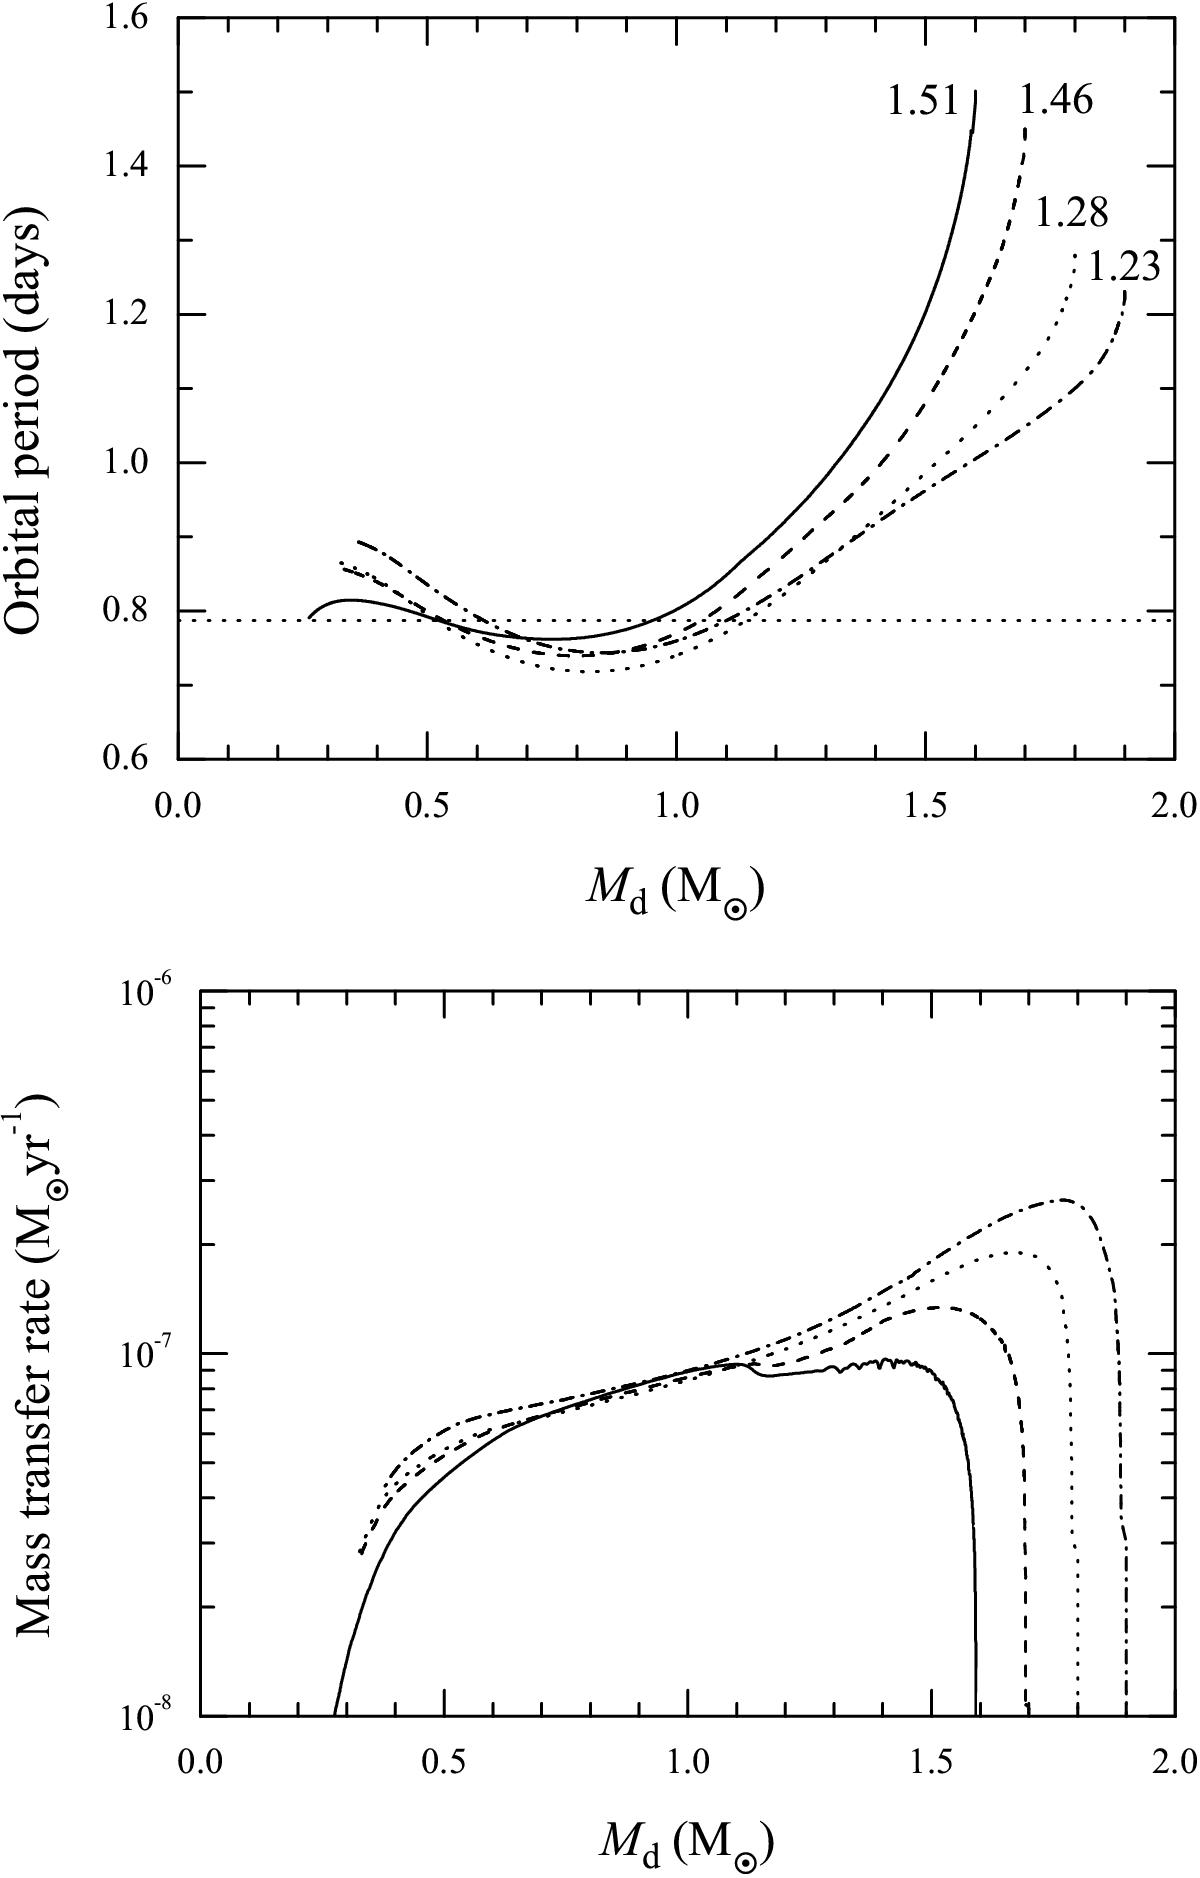
Evolutionary tracks of IMXB with different initial donor-star masses and initial orbital periods in the orbital period vs. donor-star mass (top panel) and the mass-transfer rate vs. donor-star mass (bottom panel) diagram when the surface magnetic field of the donor star Bs = 300 G. The solid, dashed, dotted, and dash-dotted curves represent a donor-star mass of 1.6, 1.7, 1.8, and 1.9M⊙, respectively. Numbers inside the curves denote the initial orbital periods in units of days. The horizontal line in the top panel corresponds to the observed orbital period of Sco X-1.
Current usage metrics show cumulative count of Article Views (full-text article views including HTML views, PDF and ePub downloads, according to the available data) and Abstracts Views on Vision4Press platform.
Data correspond to usage on the plateform after 2015. The current usage metrics is available 48-96 hours after online publication and is updated daily on week days.
Initial download of the metrics may take a while.