Fig. 5
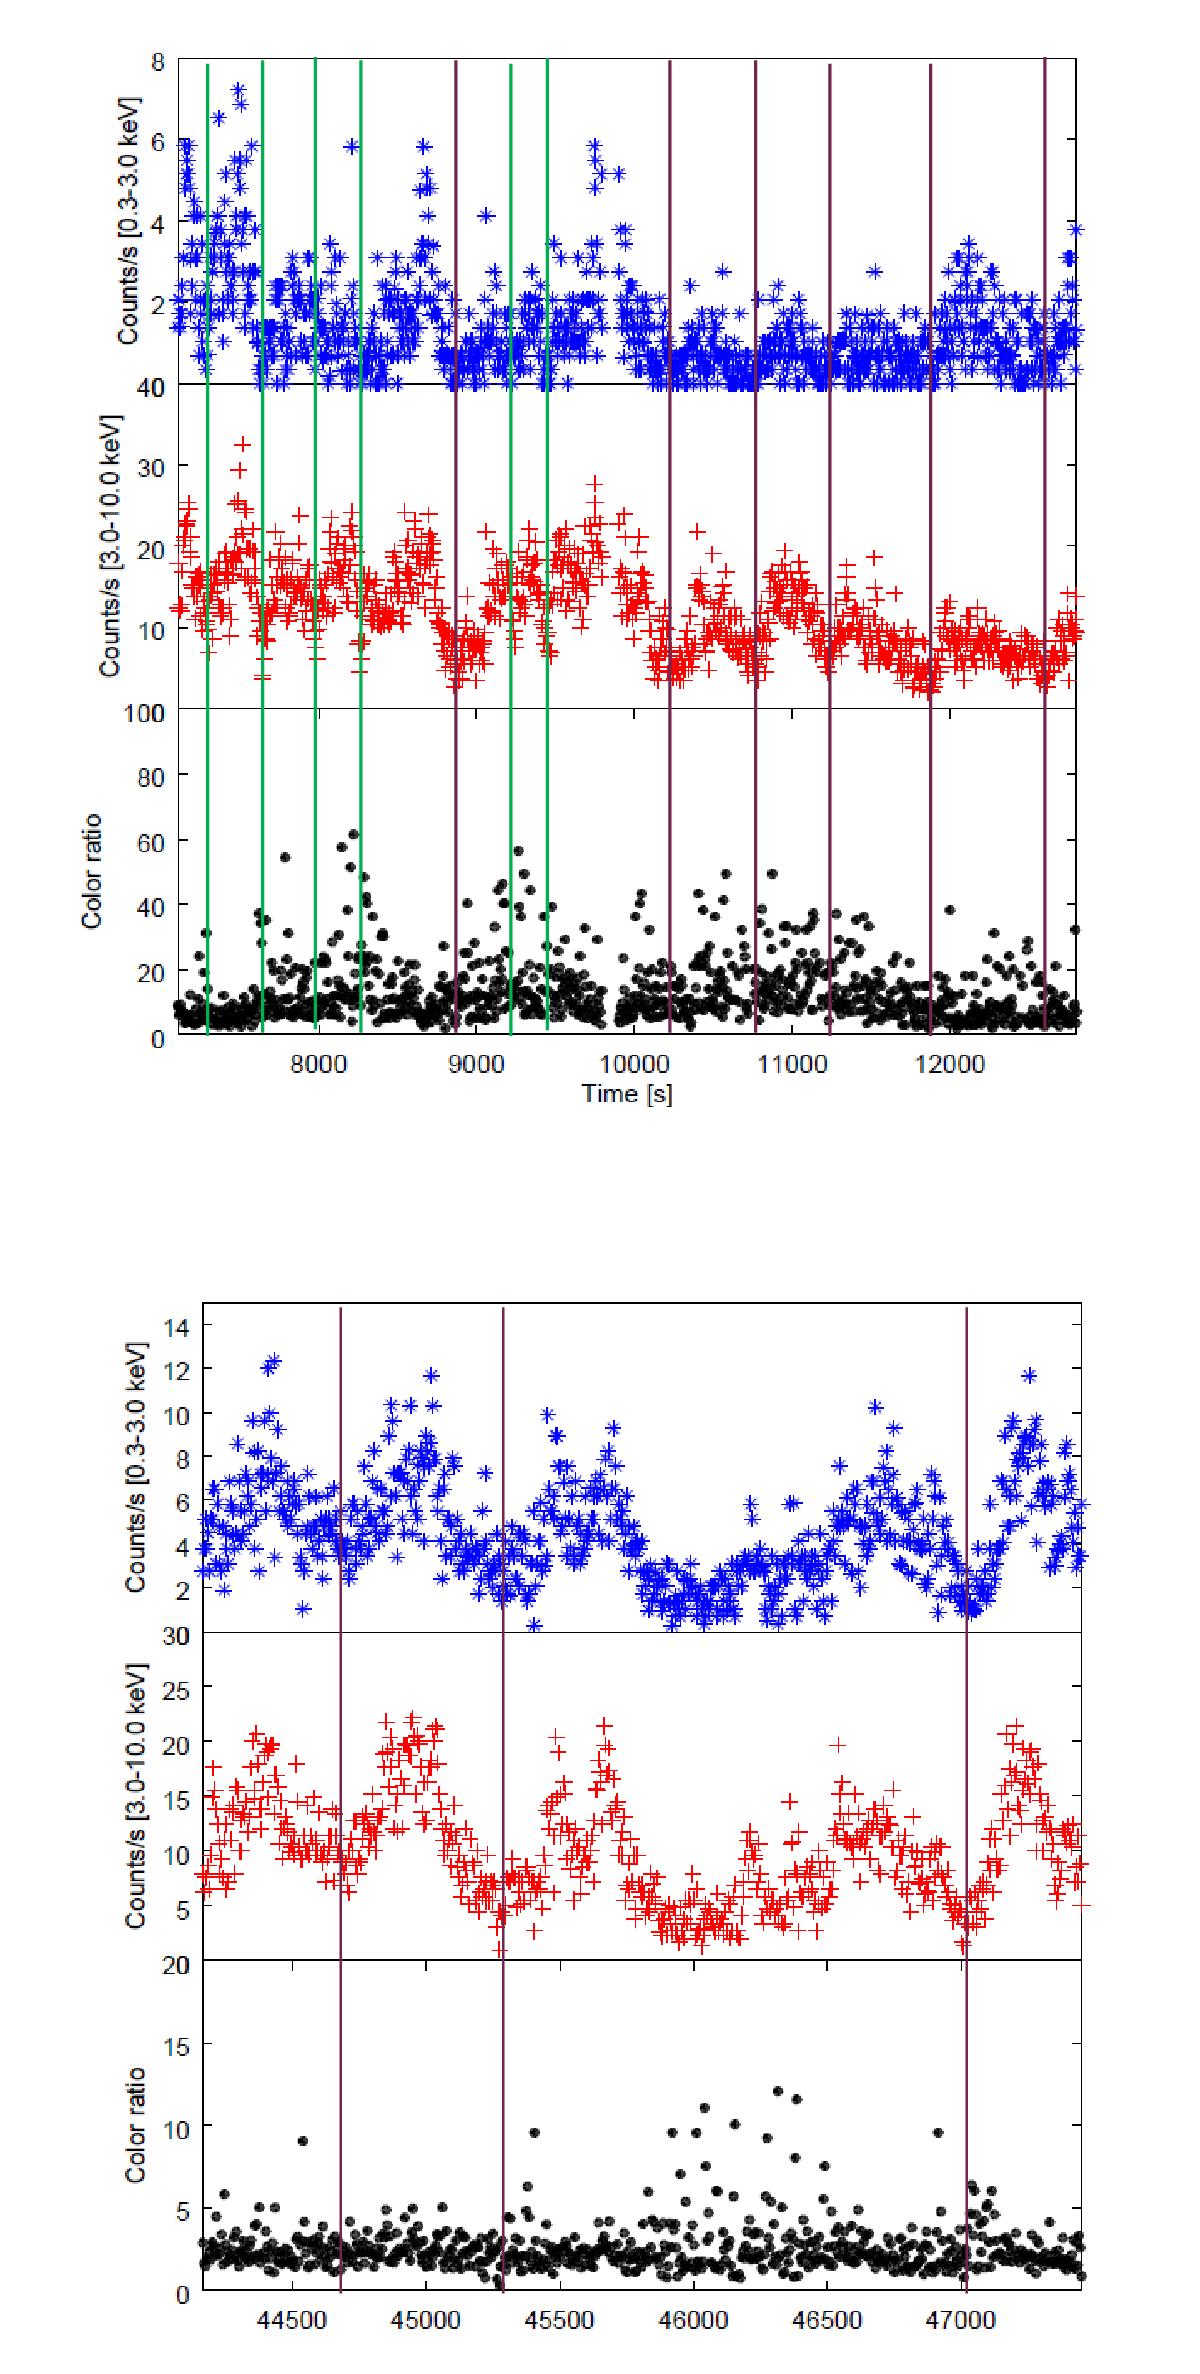
Detailed view of two light curve sections, HF2 (top panel) and HF6 (bottom panel). Each panel is additionally subdivided into three divisions. The upper division corresponds to the low-energy light curve, the middle division to the high-energy light curve, and the lower division to the colour ratio. The short and long dips are marked by green and magenta lines, respectively.
Current usage metrics show cumulative count of Article Views (full-text article views including HTML views, PDF and ePub downloads, according to the available data) and Abstracts Views on Vision4Press platform.
Data correspond to usage on the plateform after 2015. The current usage metrics is available 48-96 hours after online publication and is updated daily on week days.
Initial download of the metrics may take a while.