Fig. 2
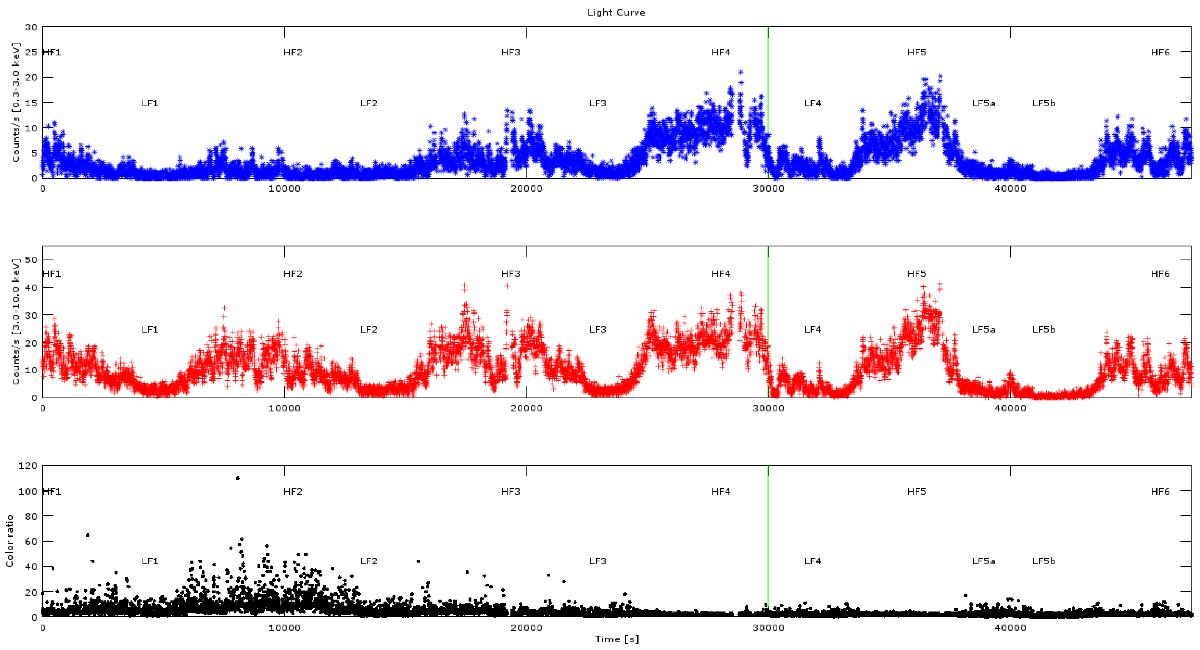
Light curve in two different energy ranges: upper panel 0.3–3.0 keV, and middle panel 3–10 keV. The lower panel shows the colour ratio (3–10) keV/(0.3–3.0) keV. The vertical green line divides T1 and T2 time intervals. The labels LF5a and LF5b refer to low-flux intervals, see text for detail. The epoch time corresponds to 57 255.50 MJD.
Current usage metrics show cumulative count of Article Views (full-text article views including HTML views, PDF and ePub downloads, according to the available data) and Abstracts Views on Vision4Press platform.
Data correspond to usage on the plateform after 2015. The current usage metrics is available 48-96 hours after online publication and is updated daily on week days.
Initial download of the metrics may take a while.