Fig. 7
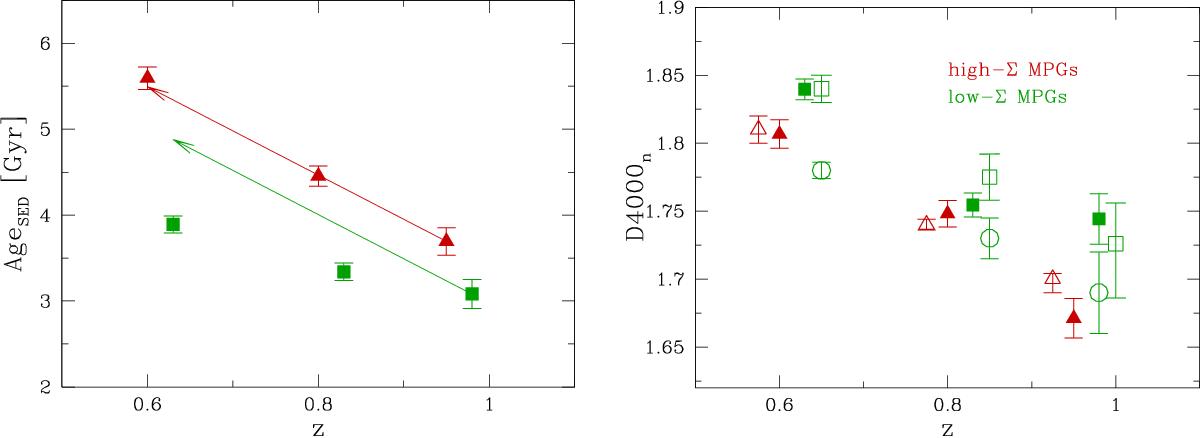
Left panel: mean stellar population ages of MPGs as derived from the SED fitting as a function of redshift and mean stellar mass density for high- and low-Σ MPGs (filled points). The colour and symbols code is the same as in Fig. 6. Error bars indicate the error on the mean. Points refer to the redshift bins 0.5![]() z<0.7,0.7
z<0.7,0.7![]() z<0.9, 0.9
z<0.9, 0.9![]() z
z![]() 1.0. The arrows track the increase of the ages in case of passive evolution from z = 0.95 to z = 0.6. Right panel: filled points: the mean values of D4000n directly measured on spectra for MPGs with different Σ (symbol and color code the same as in the left panel). Open dark red triangles indicate the values of D4000n of high-Σ MPGs derived from a BC03 model with age/τ/Z equal to the mean values derived from the SED fitting of this sub-population (D4000n,SED). Open green squares are the equivalent for low-Σ MPGs, once the aperture bias is taken into account. Actually, for high-Σ MPGs the slit aperture samples approximately the whole galaxy (see Fig. 8), thus D4000n measured directly from the spectra and D4000n,SED can be fairly compared. For low-Σ MPGs Fig. 8 shows that the slit samples just the region within 0.5 Re. In the comparison of D4000n and D4000n,SED hence, we have to take into account the effect of colour gradients (see more details in Sect. 5.2). Open green circles indicate the values of D4000n,SED of low-Σ without any correction for aperture bias.
1.0. The arrows track the increase of the ages in case of passive evolution from z = 0.95 to z = 0.6. Right panel: filled points: the mean values of D4000n directly measured on spectra for MPGs with different Σ (symbol and color code the same as in the left panel). Open dark red triangles indicate the values of D4000n of high-Σ MPGs derived from a BC03 model with age/τ/Z equal to the mean values derived from the SED fitting of this sub-population (D4000n,SED). Open green squares are the equivalent for low-Σ MPGs, once the aperture bias is taken into account. Actually, for high-Σ MPGs the slit aperture samples approximately the whole galaxy (see Fig. 8), thus D4000n measured directly from the spectra and D4000n,SED can be fairly compared. For low-Σ MPGs Fig. 8 shows that the slit samples just the region within 0.5 Re. In the comparison of D4000n and D4000n,SED hence, we have to take into account the effect of colour gradients (see more details in Sect. 5.2). Open green circles indicate the values of D4000n,SED of low-Σ without any correction for aperture bias.
Current usage metrics show cumulative count of Article Views (full-text article views including HTML views, PDF and ePub downloads, according to the available data) and Abstracts Views on Vision4Press platform.
Data correspond to usage on the plateform after 2015. The current usage metrics is available 48-96 hours after online publication and is updated daily on week days.
Initial download of the metrics may take a while.