Fig. 6
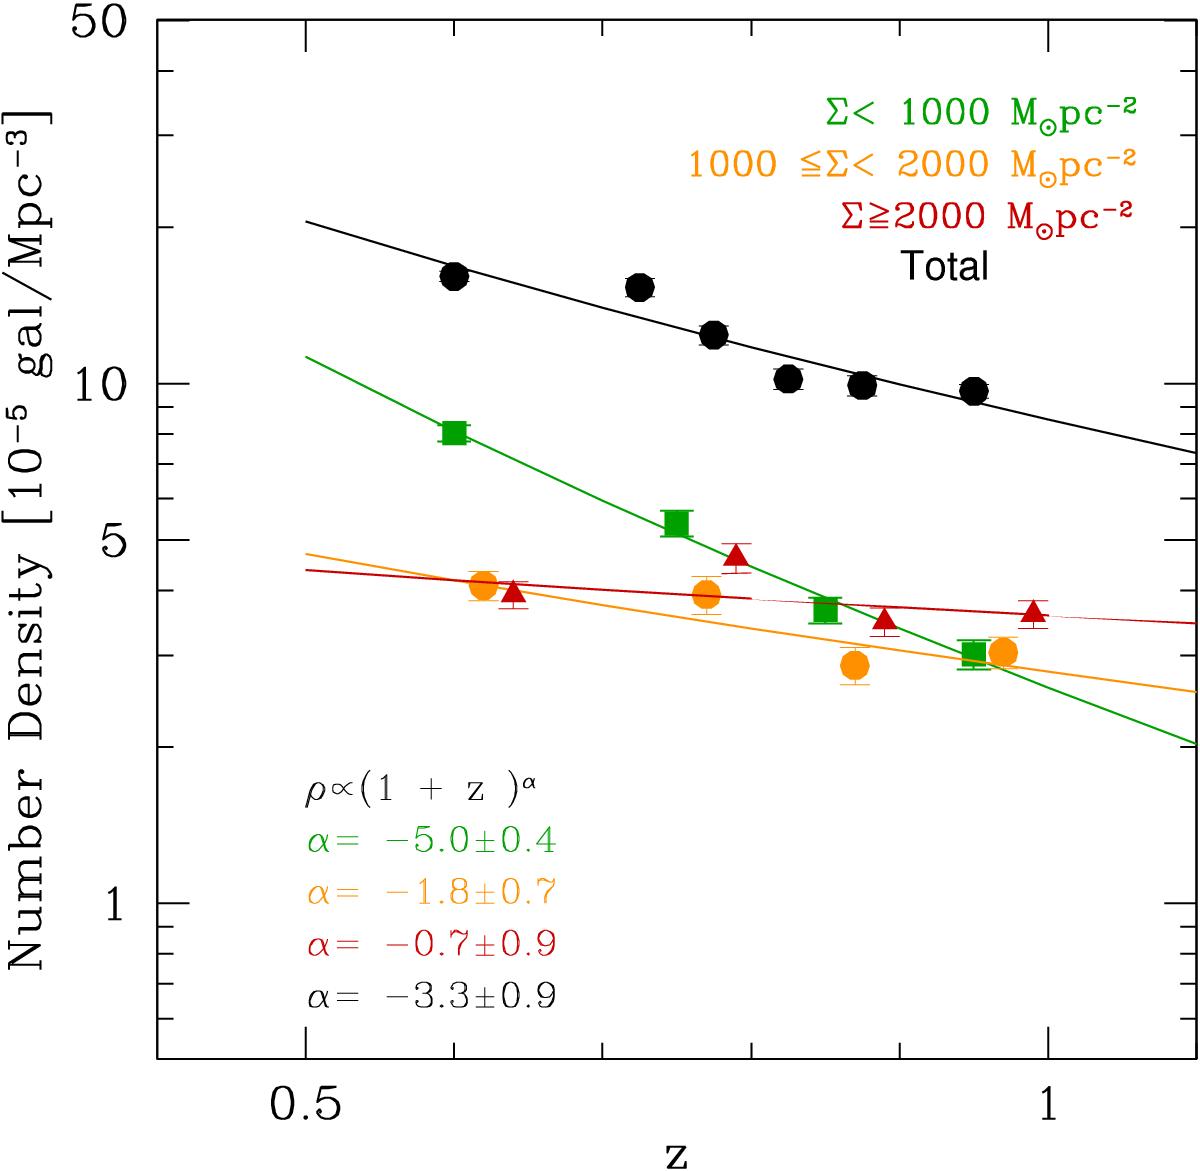
Number density of MPGs with different mean stellar mass density in VIPERS field as a function of the redshift. Dark red triangles refer to high-Σ MPGs, orange circles refer to intermediate-Σ MPGs, and green squares to low-Σ MPGs. Black circles show the number density for the total sample of MPGs. Number densities for the three sub-populations are shifted in redshift to better visualize them. The error bars correspond to 1σ. We fitted the data with a power law and solid lines are the best-fit relations.
Current usage metrics show cumulative count of Article Views (full-text article views including HTML views, PDF and ePub downloads, according to the available data) and Abstracts Views on Vision4Press platform.
Data correspond to usage on the plateform after 2015. The current usage metrics is available 48-96 hours after online publication and is updated daily on week days.
Initial download of the metrics may take a while.