Free Access
Fig. 2
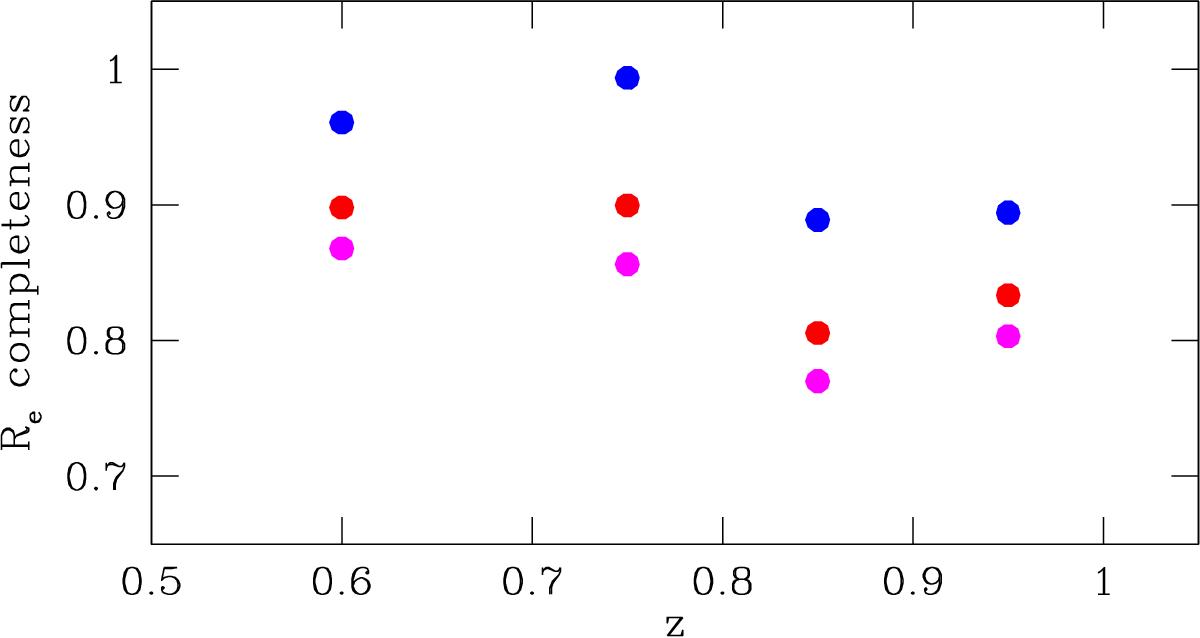
Fraction of MPGs with available Re in the W1 field (magenta filled points), in the W4 field (blue filled points) as a function of z. At z<0.8, MPGs with Re derived from i-band images are included. Red filled points indicate the completeness for the W1+W4 field.
Current usage metrics show cumulative count of Article Views (full-text article views including HTML views, PDF and ePub downloads, according to the available data) and Abstracts Views on Vision4Press platform.
Data correspond to usage on the plateform after 2015. The current usage metrics is available 48-96 hours after online publication and is updated daily on week days.
Initial download of the metrics may take a while.