Fig. C.1
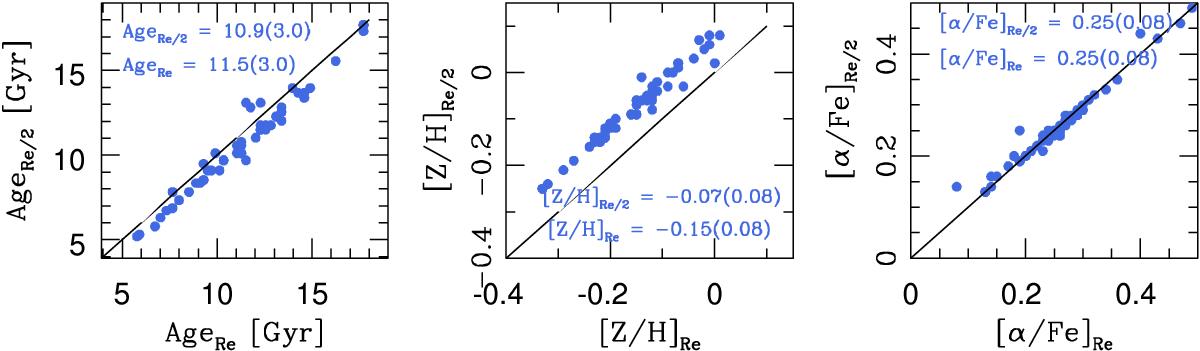
Left panel: stellar population age within 0.5 Re vs. the stellar population age within Re for local ETGs with dynamical mass log MJAM>10.9 and Σ<1000 M⊙ pc-2 (green points). Solid line is the 1:1 correlation. Mean value of ages at Re and at 0.5 Re are reported in the panel. Central and right panels: as left panel but for stellar metallicity and α enhancement, respectively.
Current usage metrics show cumulative count of Article Views (full-text article views including HTML views, PDF and ePub downloads, according to the available data) and Abstracts Views on Vision4Press platform.
Data correspond to usage on the plateform after 2015. The current usage metrics is available 48-96 hours after online publication and is updated daily on week days.
Initial download of the metrics may take a while.