Fig. B.1
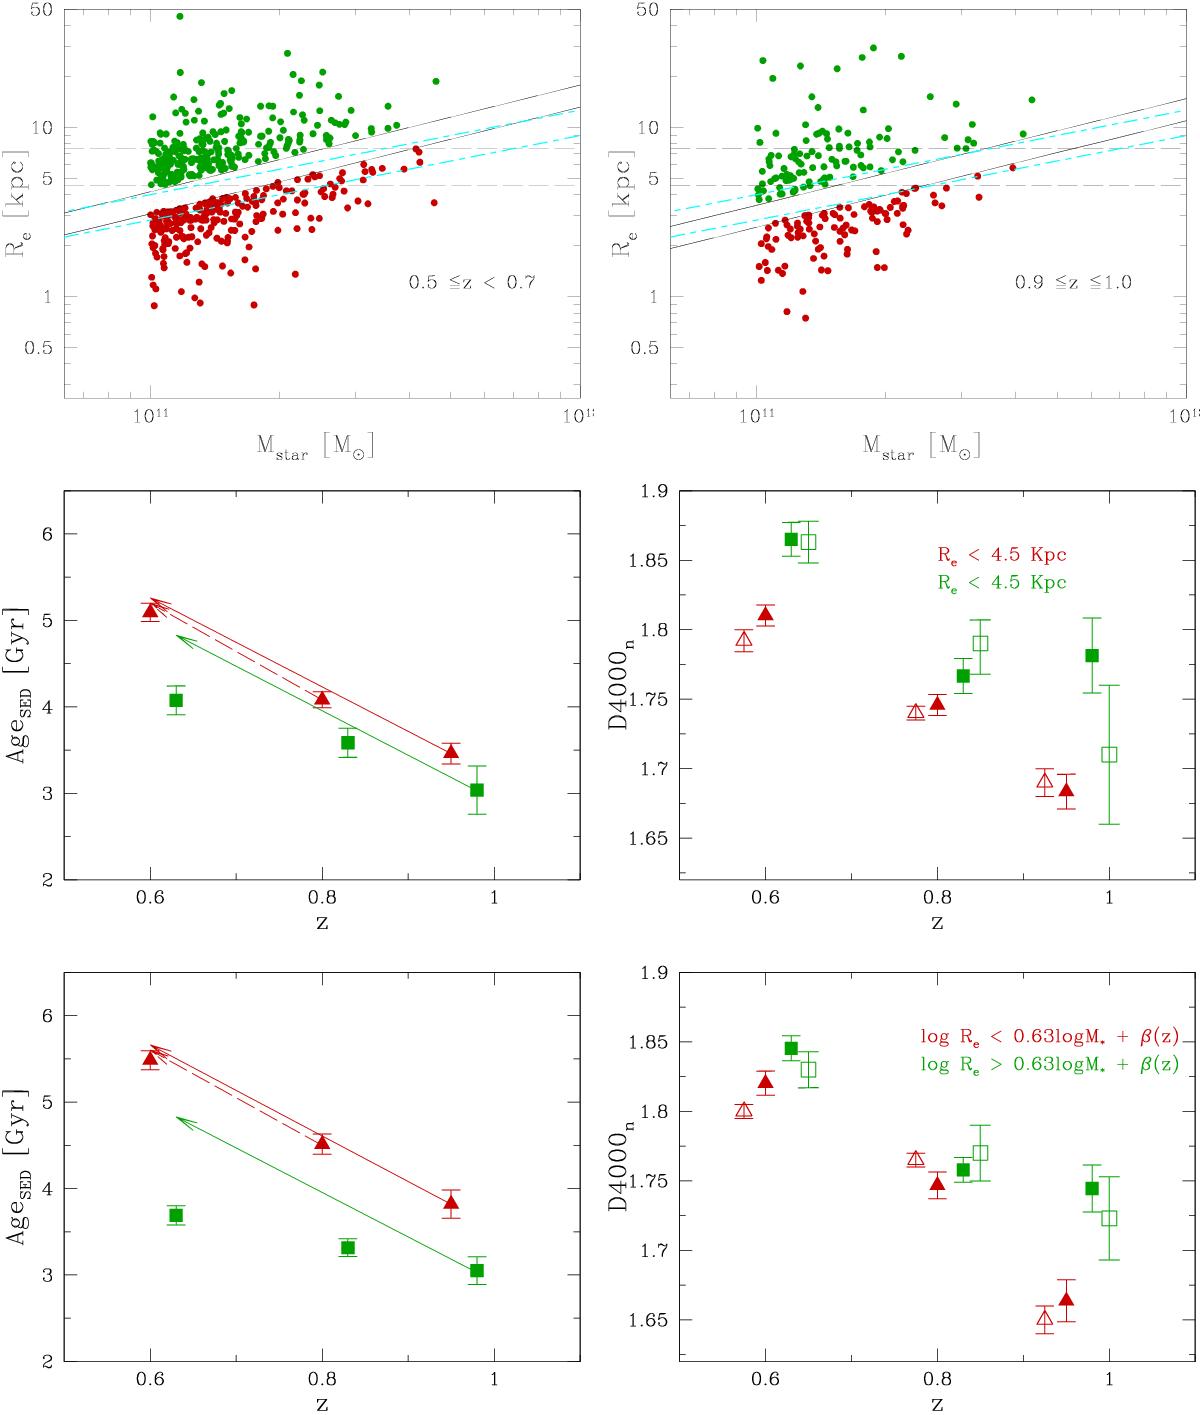
Upper panels: selection criteria of dense and less dense MPGs in this work and in F16 work reported in the size mass plane, in two redshift bins (0.5![]() z<0.7 in the left panel; and 0.9
z<0.7 in the left panel; and 0.9![]() z
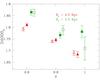
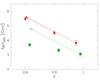
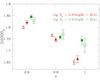
z![]() 1.0 in the right panel). Dashed cyan lines indicate the cut we apply in the analysis presented in this paper (namely Σ = 1000 M⊙ pc-2 and Σ = 2000 M⊙ pc-2). Black lines indicate the two criteria adopted in F16: dashed horizontal lines are the selection at constant Re, while solid lines are the selection along the SMR such to select the 35% of the densest (dark red points) and less dense (green points) galaxies in that redshift bin. This selection is redshift dependent. Middle panels: evolution of the age as derived by the fit of the SED (left panel) for MPGs with Re<4.5 kpc dark red points and with Re>7.5 kpc green points (left panel) and the corresponding evolution of the mean D4000n (right panel). In the left panels the solid (dashed) arrow indicate the increase of the age in case of passive evolution since z = 0.95(0.8). In the right panel, open symbols indicate the value of D4000n,SED expected from the best-fit values of SED. In both panels error bars indicate the errors on the mean. In the highest redshift bin the largest error for less dense galaxies is principally due to the smaller statistics of the sample (<30 galaxies) with respect to the others bins (>100 galaxies). Lower panels: as middle panels but for MPGs selected along the SMR (red and green points in the upper panels).
1.0 in the right panel). Dashed cyan lines indicate the cut we apply in the analysis presented in this paper (namely Σ = 1000 M⊙ pc-2 and Σ = 2000 M⊙ pc-2). Black lines indicate the two criteria adopted in F16: dashed horizontal lines are the selection at constant Re, while solid lines are the selection along the SMR such to select the 35% of the densest (dark red points) and less dense (green points) galaxies in that redshift bin. This selection is redshift dependent. Middle panels: evolution of the age as derived by the fit of the SED (left panel) for MPGs with Re<4.5 kpc dark red points and with Re>7.5 kpc green points (left panel) and the corresponding evolution of the mean D4000n (right panel). In the left panels the solid (dashed) arrow indicate the increase of the age in case of passive evolution since z = 0.95(0.8). In the right panel, open symbols indicate the value of D4000n,SED expected from the best-fit values of SED. In both panels error bars indicate the errors on the mean. In the highest redshift bin the largest error for less dense galaxies is principally due to the smaller statistics of the sample (<30 galaxies) with respect to the others bins (>100 galaxies). Lower panels: as middle panels but for MPGs selected along the SMR (red and green points in the upper panels).
Current usage metrics show cumulative count of Article Views (full-text article views including HTML views, PDF and ePub downloads, according to the available data) and Abstracts Views on Vision4Press platform.
Data correspond to usage on the plateform after 2015. The current usage metrics is available 48-96 hours after online publication and is updated daily on week days.
Initial download of the metrics may take a while.