Fig. A.1
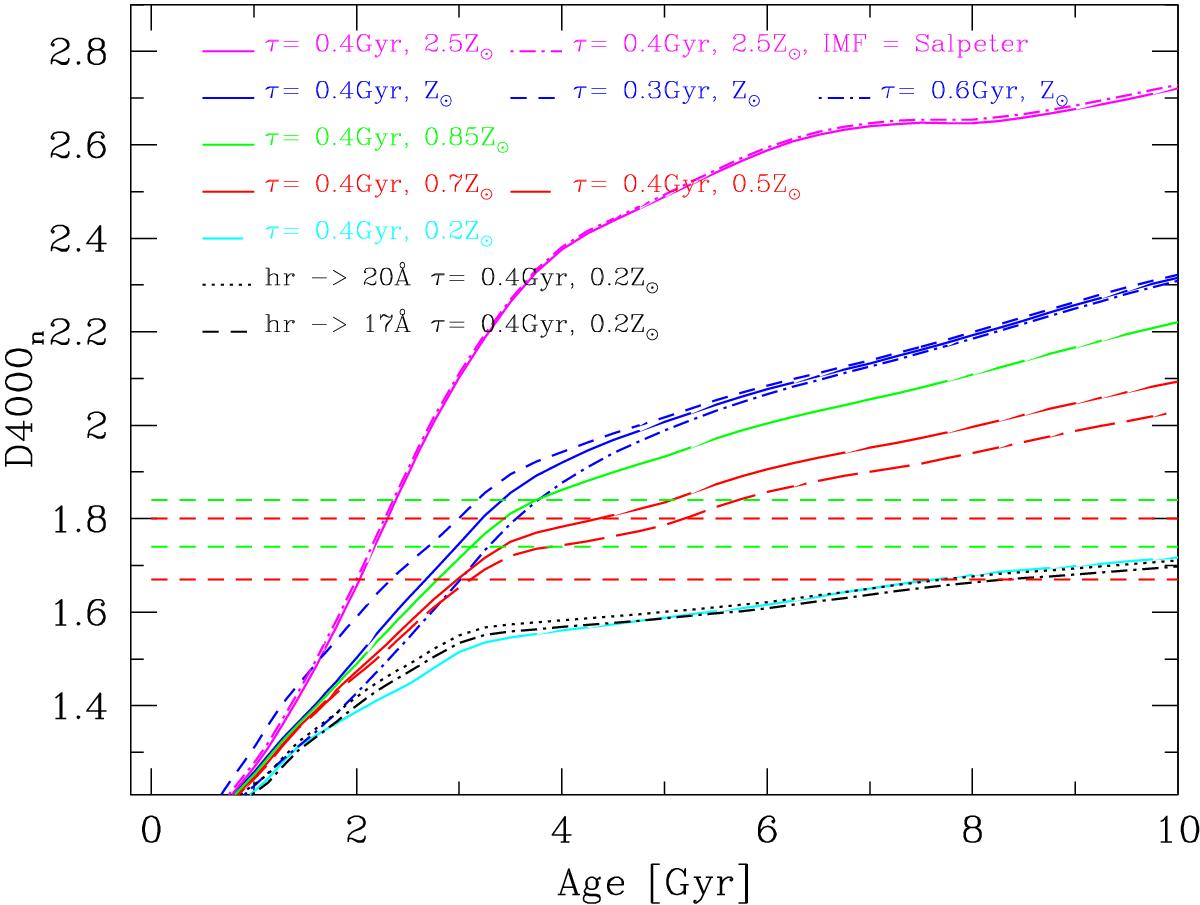
D4000n index as a function of the age for BC03 low resolution models with exponentially declining star formation history, the Chabier IMF (when not otherwise specified), and different τ and Z. Solid magenta, solid blue, solid green, solid red, red-dashed and solid cyan lines correspond to models with τ = 0.4 Gyr and Z = 2.5 Z⊙, Z⊙, 0.85 Z⊙, 0.7 Z⊙, 0.5 Z⊙ and 0.2 Z⊙. Dashed and dot-dashed blue lines indicate models with Z = Z⊙ and τ = 0.3 Gyr and 0.6 Gyr, respectively. Dotted and dashed black lines indicate models with Z = 0.2 Z⊙, τ = 0.4 Gyr and resolution 20 Å and 17 Å respectively. Dot-dashed magenta line indicates the evolution of D4000n index for models with Z = 2.5 Z⊙, τ = 0.4 Gyr and the Salpeter IMF (Salpeter 1955). Dashed horizontal green and red lines indicate the value of D4000n at z = 1.0 and at z = 0.5 for low- and high-Σ MPGs, respectively.
Current usage metrics show cumulative count of Article Views (full-text article views including HTML views, PDF and ePub downloads, according to the available data) and Abstracts Views on Vision4Press platform.
Data correspond to usage on the plateform after 2015. The current usage metrics is available 48-96 hours after online publication and is updated daily on week days.
Initial download of the metrics may take a while.