Fig. 1
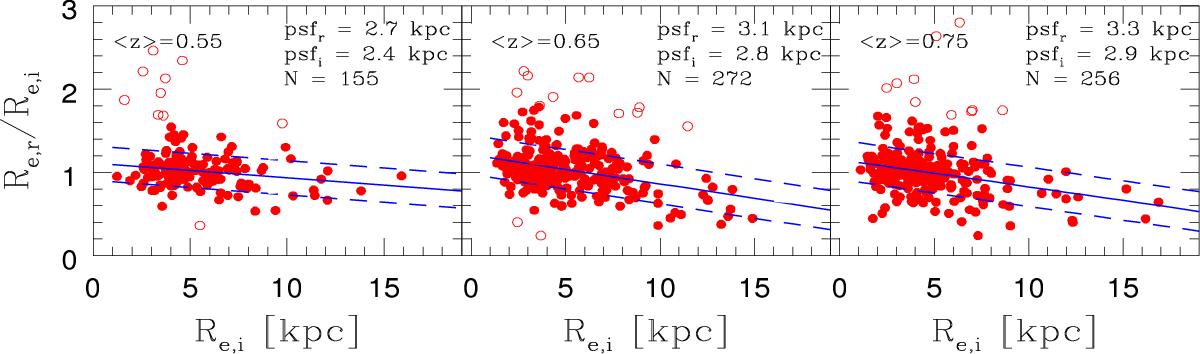
Ratio between the effective radius in r band (Re,r) and the effective radius in i band (Re,i) as a function of Re,i for MPGs in three bins of redshift as indicated in the top left corner of each plot. In the three panels, the solid blue lines are the best fit relations derived with a sigma-clipping algorithm. Dashed blue lines set the 1σ deviation. The typical dimension of half of the PSF-FWHM of both i-band and r-band images is indicated in the top right corner of each plot with also the number of objects. Open red circles are galaxies at >3σ from this fit.
Current usage metrics show cumulative count of Article Views (full-text article views including HTML views, PDF and ePub downloads, according to the available data) and Abstracts Views on Vision4Press platform.
Data correspond to usage on the plateform after 2015. The current usage metrics is available 48-96 hours after online publication and is updated daily on week days.
Initial download of the metrics may take a while.