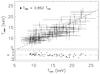
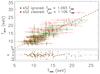
Fig. 3
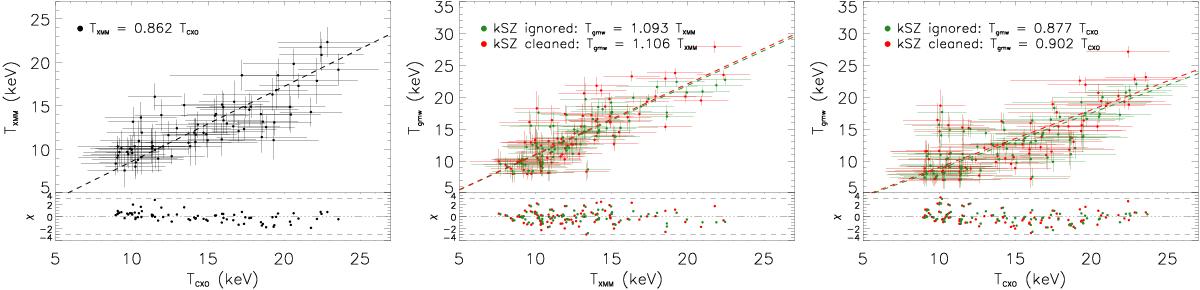
Correlation between the temperature maps of Fig. 2 and residual. Left: XMM-Newton vs. Chandra spectroscopic temperatures is shown. Middle: tSZ+X-ray imaging (model M1) vs. XMM-Newton spectroscopy is shown. Right: tSZ+X-ray imaging (model M1) vs. Chandra spectroscopy is shown. The red and green dots correspond to the case with and without the kSZ correction, respectively.
Current usage metrics show cumulative count of Article Views (full-text article views including HTML views, PDF and ePub downloads, according to the available data) and Abstracts Views on Vision4Press platform.
Data correspond to usage on the plateform after 2015. The current usage metrics is available 48-96 hours after online publication and is updated daily on week days.
Initial download of the metrics may take a while.