Free Access
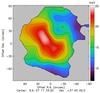
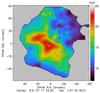
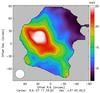
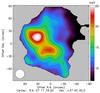
Fig. 2
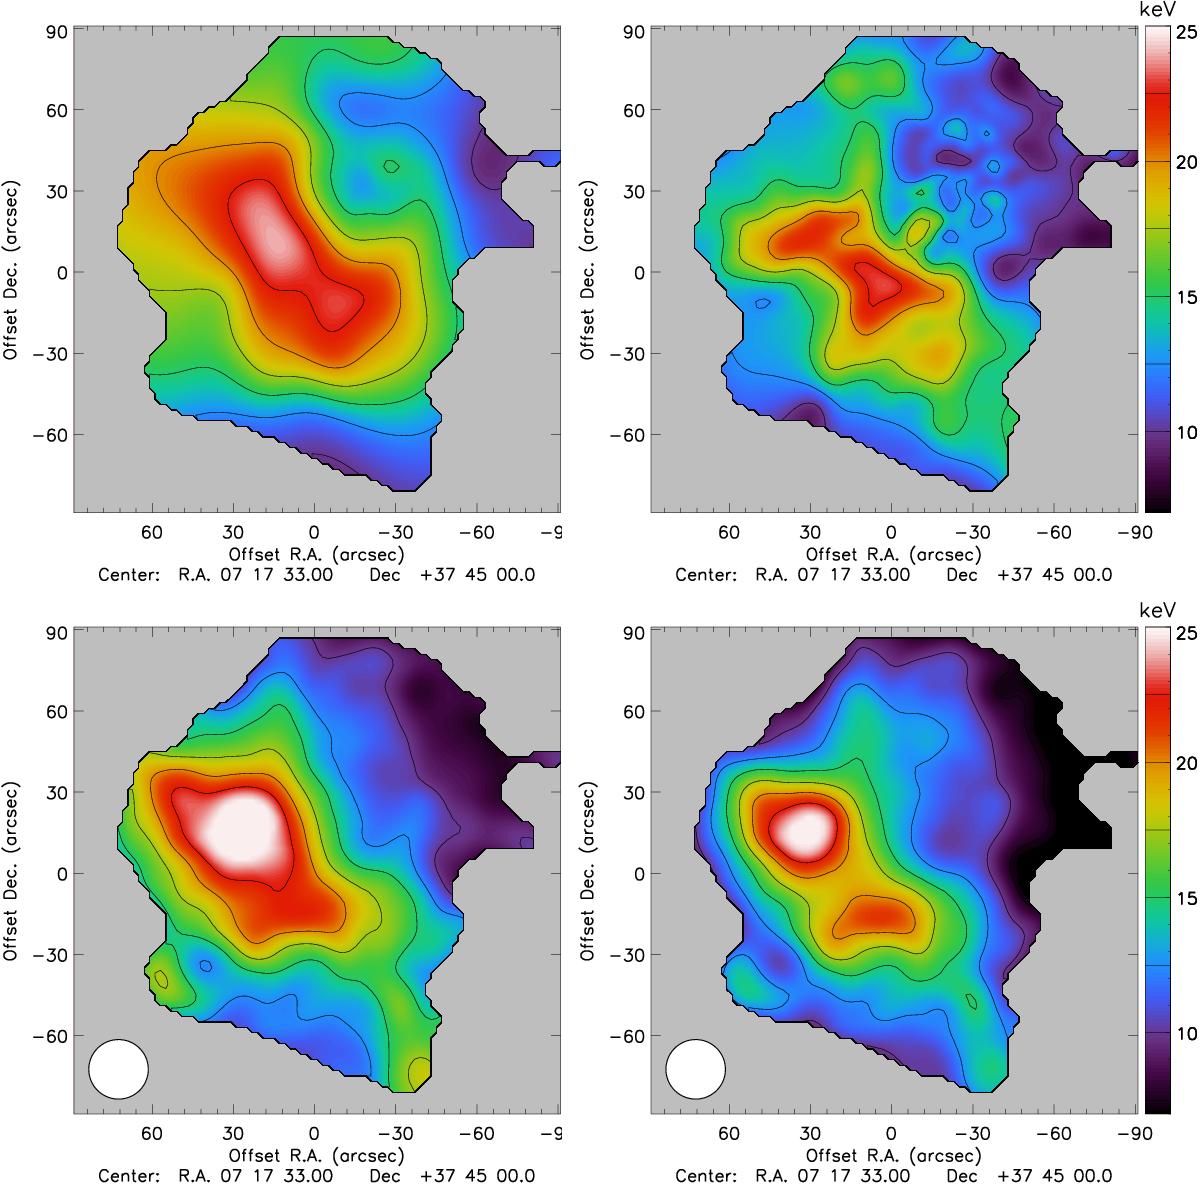
Temperature maps. Top: spectroscopic temperature derived from Chandra (TCXO, left panel) and from XMM-Newton (TXMM, right panel) are shown. Bottom: NIKA and XMM-Newton imaging derived temperature, TSZX, for model M1 (left panel) and model M3a (right panel) are shown. These maps are corrected for the zero level.
This figure is made of several images, please see below:
Current usage metrics show cumulative count of Article Views (full-text article views including HTML views, PDF and ePub downloads, according to the available data) and Abstracts Views on Vision4Press platform.
Data correspond to usage on the plateform after 2015. The current usage metrics is available 48-96 hours after online publication and is updated daily on week days.
Initial download of the metrics may take a while.