Free Access
Fig. 7
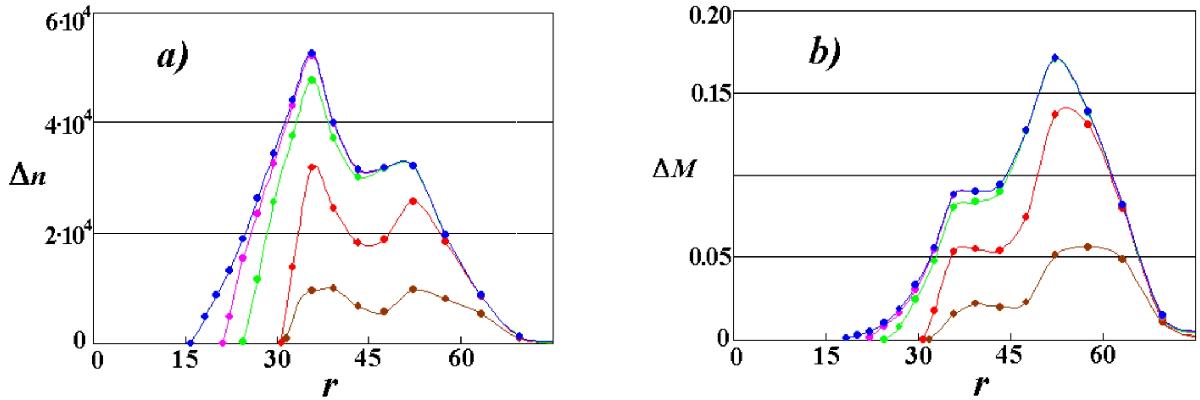
Distributions of breakaway droplets by sizes: Δn(r)(a) and ΔM(r)(b). Variant II: slow iron meteoroid. Blue indicates the final distribution at τ = 3.11; brown, red, light green, and crimson indicate, respectively, the intermediate distributions at τ = 0.30, 0.93, 1.88, and 2.48; tch = 5.15 × 10⁻³ s. See Movie 2.
Current usage metrics show cumulative count of Article Views (full-text article views including HTML views, PDF and ePub downloads, according to the available data) and Abstracts Views on Vision4Press platform.
Data correspond to usage on the plateform after 2015. The current usage metrics is available 48-96 hours after online publication and is updated daily on week days.
Initial download of the metrics may take a while.