Fig. A.1
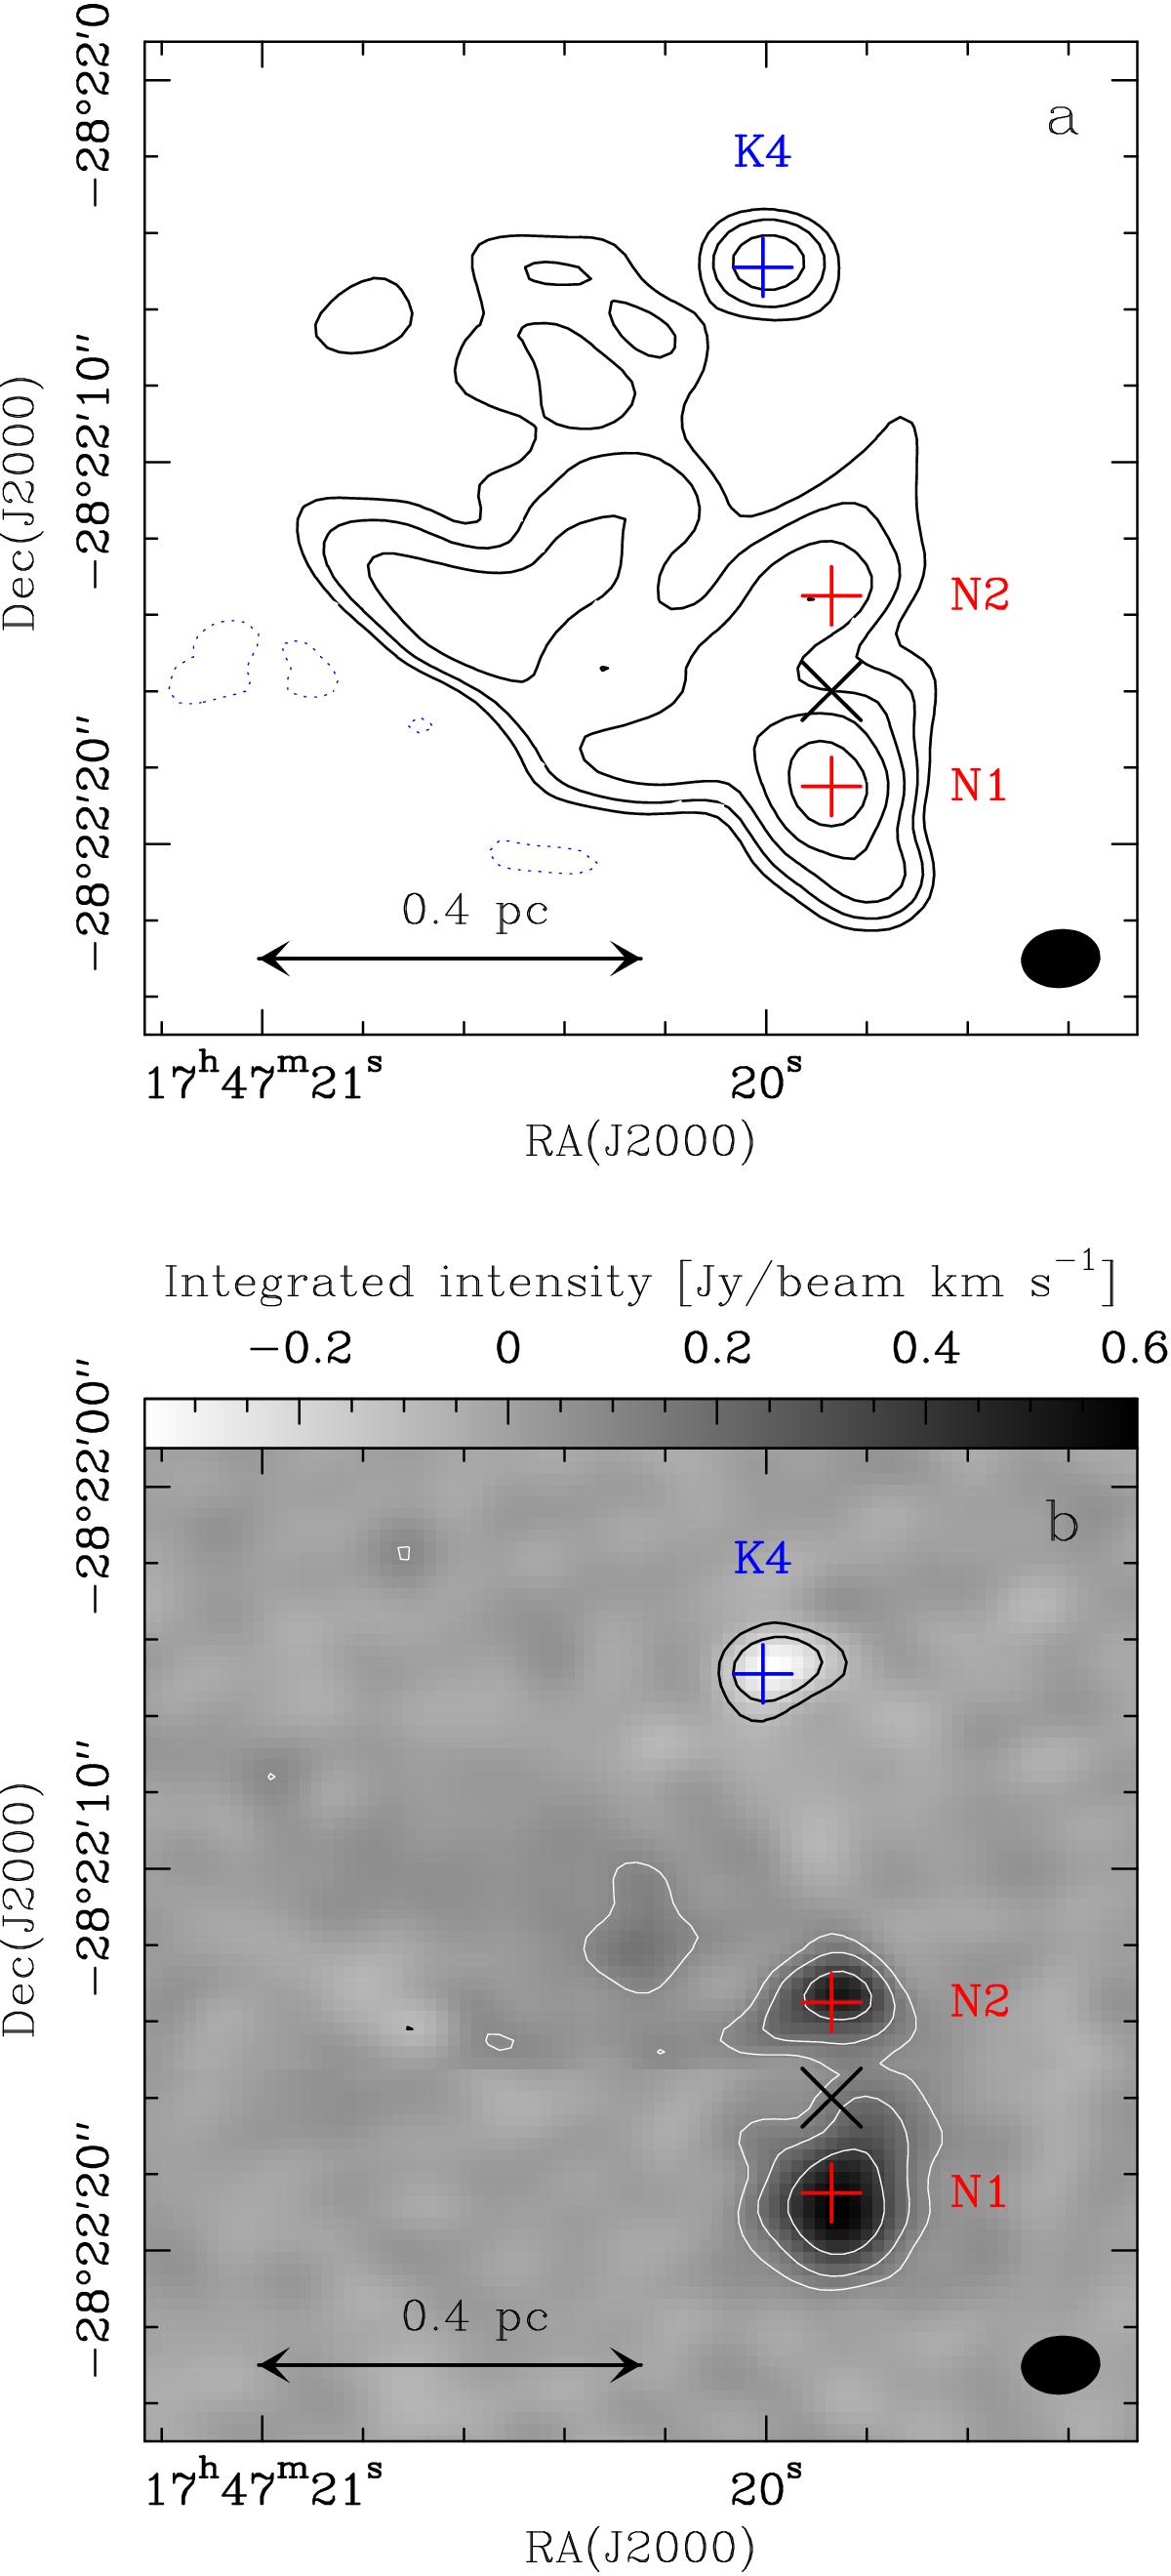
Panel a: ALMA continuum map of the Sgr B2(N) region at 85 GHz. The level of the first contour (positive as black solid line and negative as dashed blue line) is 5σ, with σ the rms noise level of 5.4 mJy/beam. The contour step doubles at each contour. Panel b: Integrated intensity map of the NH2CHO absorption of the GC diffuse clouds (vLSR = − 8.9–6.6 km s-1) at 84.5 GHz. The first contour level (positive in white and negative in black) is 5σ, with σ = 17.7 mJy/beam km s-1. The contour step doubles at each contour. The grey-scale is indicated at the top. The continuum emission was subtracted. In both panels, the filled ellipse shows the synthesised beam (2.1″ × 1.5″), the black cross indicates the phase centre, the red crosses the positions of the hot cores Sgr B2(N1) and Sgr B2(N2), and the blue cross the position of the ultracompact H ii region K4.
Current usage metrics show cumulative count of Article Views (full-text article views including HTML views, PDF and ePub downloads, according to the available data) and Abstracts Views on Vision4Press platform.
Data correspond to usage on the plateform after 2015. The current usage metrics is available 48-96 hours after online publication and is updated daily on week days.
Initial download of the metrics may take a while.