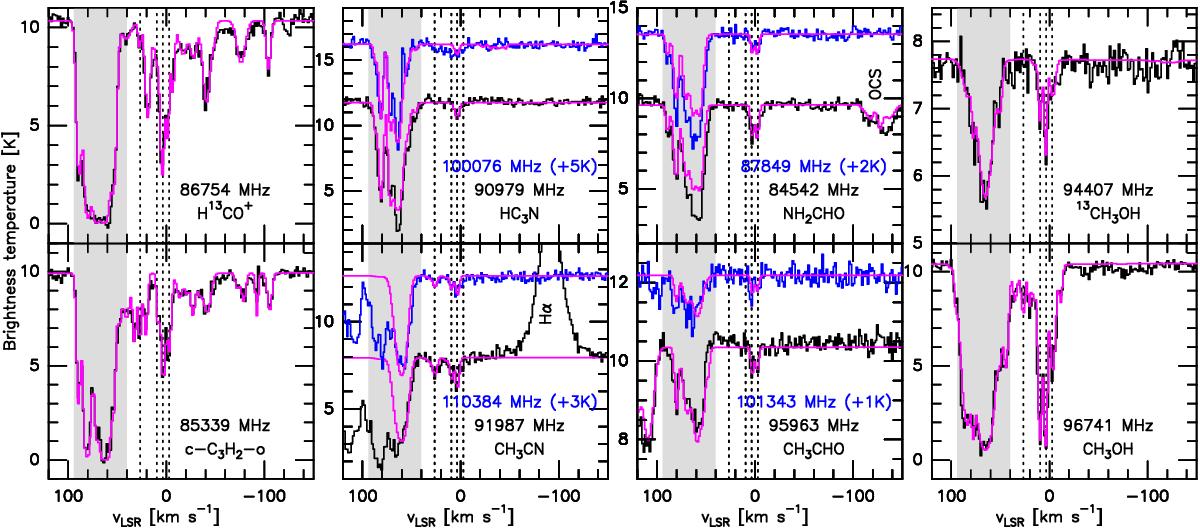
Fig. 1

Absorption spectra of simple and complex organic molecules towards the UCH ii region K4 in Sgr B2(N). The strongest transition is shown in black and the next strongest, if any, in blue. The molecules and rest frequencies of the transitions are given in each panel. The blue spectra are shifted upwards by the value given in parentheses. The synthetic spectra are overlain in magenta. The four dotted lines mark the median centroid velocities of the components detected for the complex species: 26.7, 9.4, 3.4, and − 2.8 km s-1. The absorption line at 110 km s-1 close to the line of CH3CHO at 95963 MHz is another transition of the same molecule. The grey area indicates the velocity range of the Sgr B2 envelope.
Current usage metrics show cumulative count of Article Views (full-text article views including HTML views, PDF and ePub downloads, according to the available data) and Abstracts Views on Vision4Press platform.
Data correspond to usage on the plateform after 2015. The current usage metrics is available 48-96 hours after online publication and is updated daily on week days.
Initial download of the metrics may take a while.


