Fig. 4
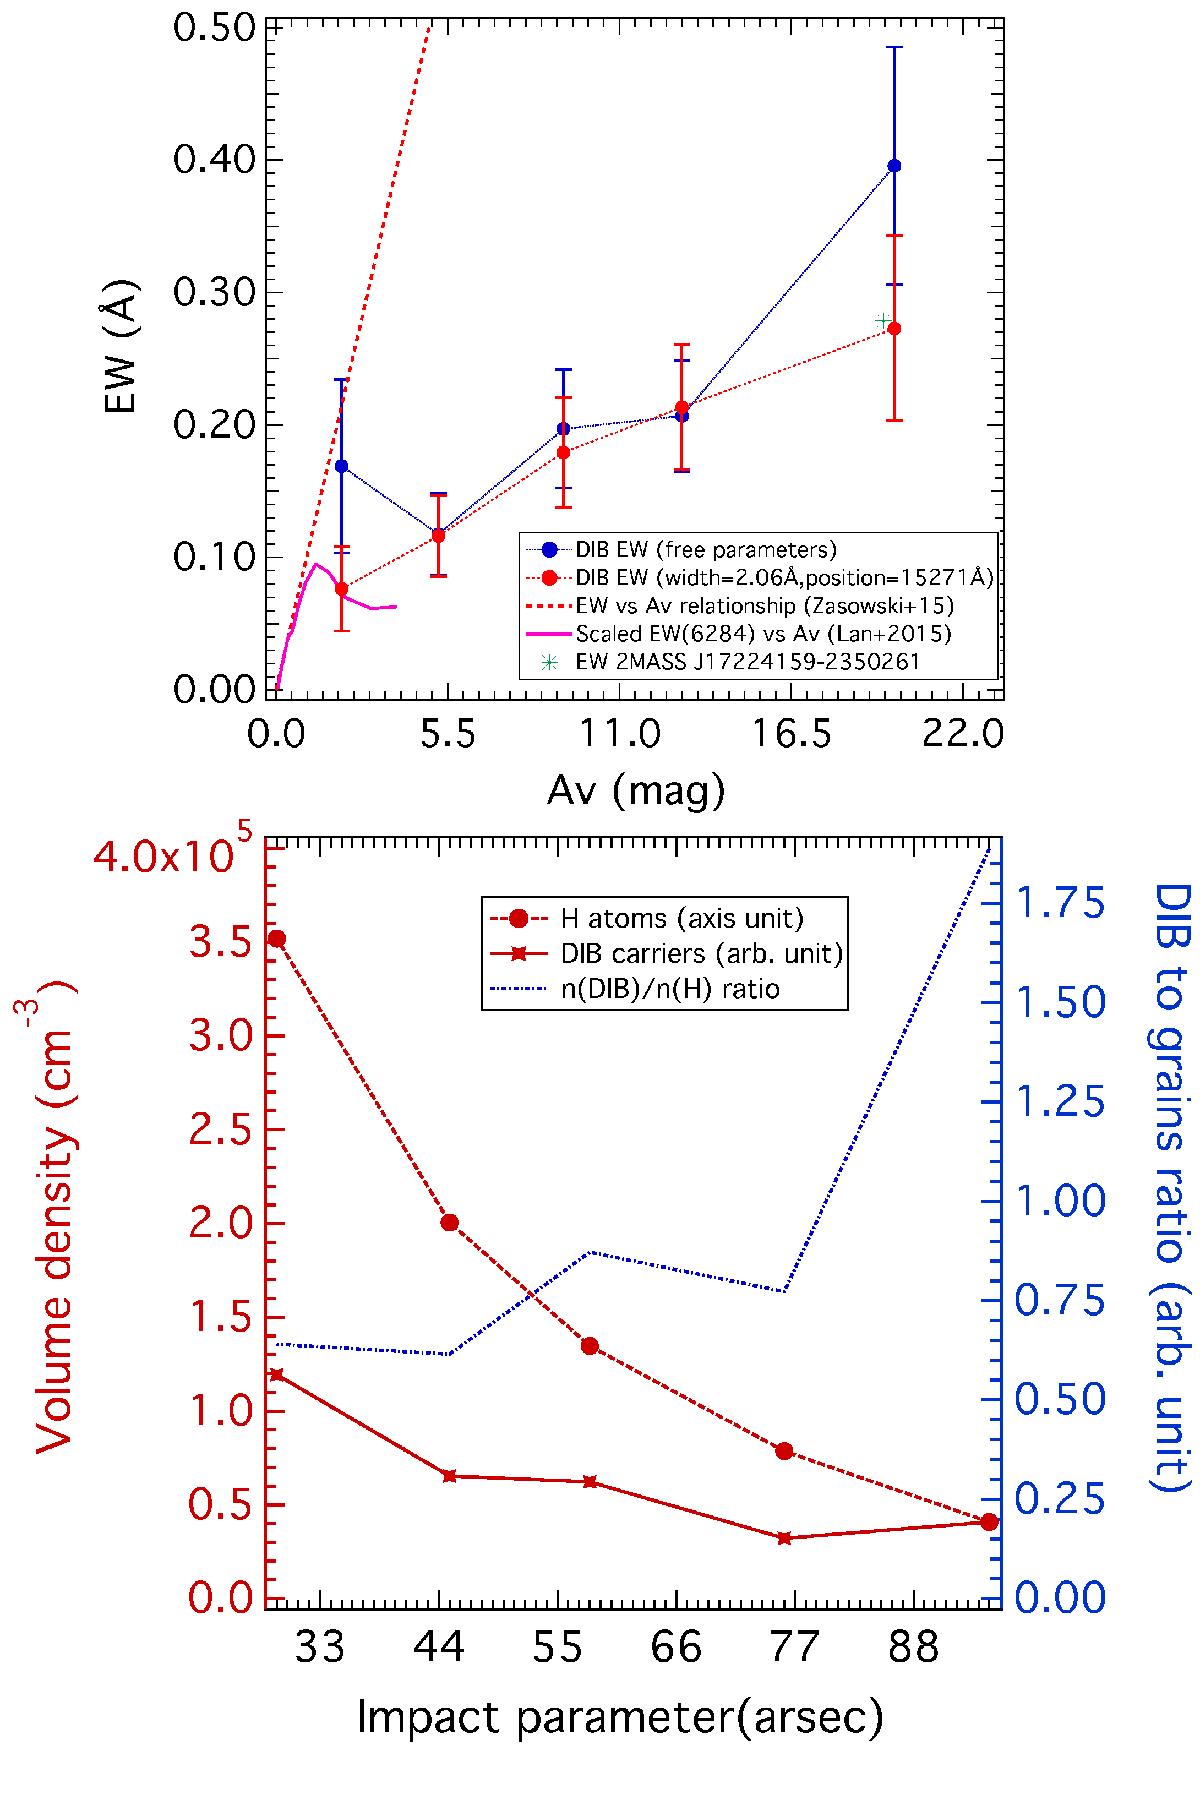
Top: DIB EW vs. AV for the five average spectra. Blue and red points correspond to the two fitting procedures (see text). The dashed red curve represents the Zasowski et al. (2015) relation. The pink line is the Lan et al. (2015) EW vs. AV relationship for the 6284 Å DIB, scaled to match the strength of the 15 273 Å DIB at AV ≤ 1 (see text). Bottom: volume density of DIB carrier n(DIB) based on the simplified inversion of EWs (left scale). Also shown is the inverted volume density n(H) based on AV data. The n(DIB) has been artificially scaled in such a way the two curves cross for the external layer. The ratio between the DIB carrier and H volume densities is also shown (right scale).
Current usage metrics show cumulative count of Article Views (full-text article views including HTML views, PDF and ePub downloads, according to the available data) and Abstracts Views on Vision4Press platform.
Data correspond to usage on the plateform after 2015. The current usage metrics is available 48-96 hours after online publication and is updated daily on week days.
Initial download of the metrics may take a while.