Free Access
Fig. 3
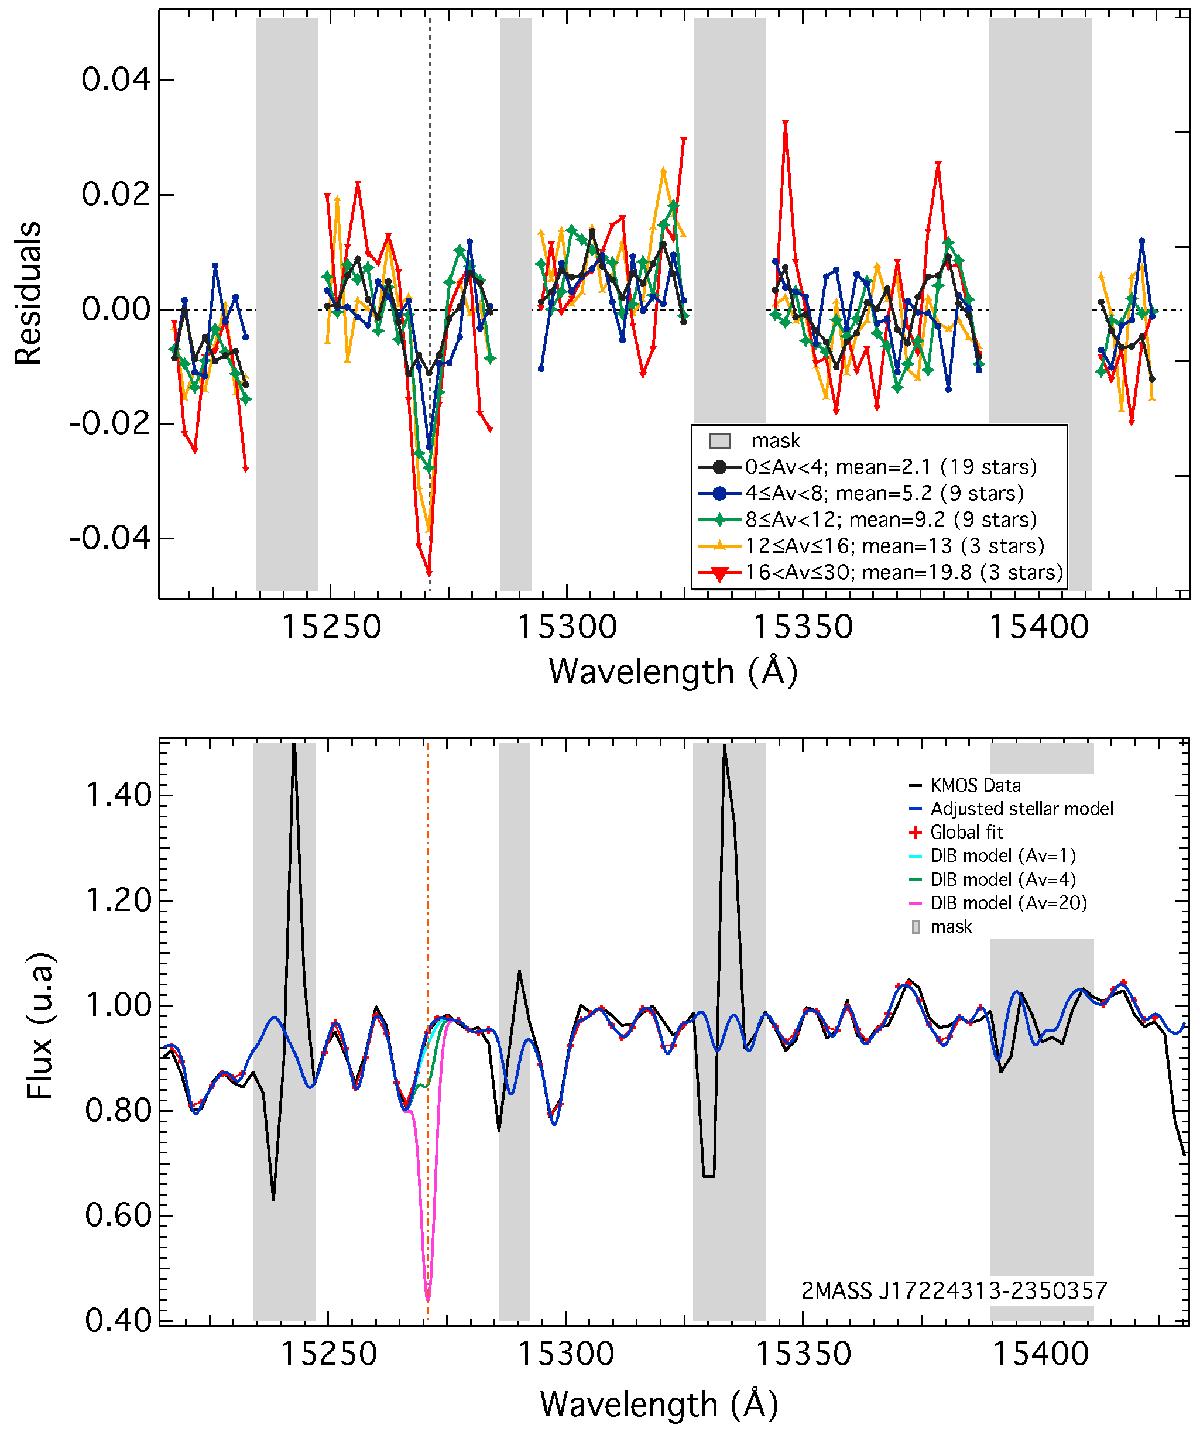
Top: residuals of model adjustments to the five average spectra (DIB excluded). Colors correspond to those in Fig. 1. Bottom: a target spectrum (in black) and its fitted model outside the DIB region (blue). Simulated Gaussian absorptions representing a DIB with the expected strength for AV = 1, 4 and 20 mag resp. are added.
Current usage metrics show cumulative count of Article Views (full-text article views including HTML views, PDF and ePub downloads, according to the available data) and Abstracts Views on Vision4Press platform.
Data correspond to usage on the plateform after 2015. The current usage metrics is available 48-96 hours after online publication and is updated daily on week days.
Initial download of the metrics may take a while.