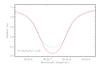
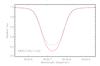
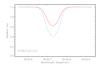
Fig. 9
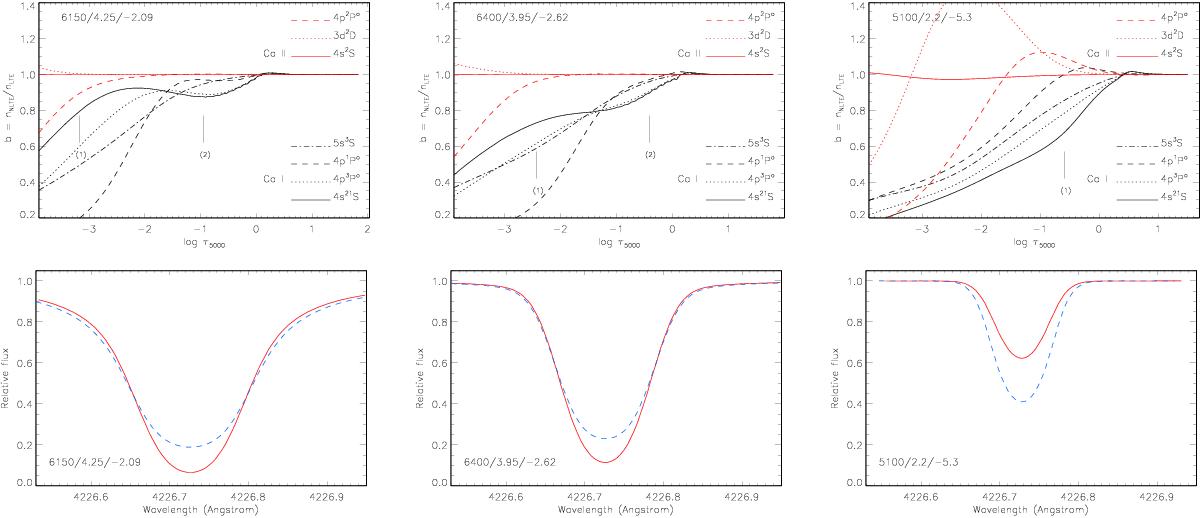
Top row: departure coefficients for selected levels of Ca i and Ca ii as a function of log τ5000 in the models representing atmospheres of BD + 09°0352, BD −13°3442, and HE 0107-5240. Tick marks indicate the locations of line centre optical depth unity for Ca i 4226 Å (1) and Ca i 6162 Å (2). Bottom row: NLTE (continuous curve) and LTE (dashed curve) theoretical profiles of Ca i 4226 Å in the corresponding models.
Current usage metrics show cumulative count of Article Views (full-text article views including HTML views, PDF and ePub downloads, according to the available data) and Abstracts Views on Vision4Press platform.
Data correspond to usage on the plateform after 2015. The current usage metrics is available 48-96 hours after online publication and is updated daily on week days.
Initial download of the metrics may take a while.