Fig. 2
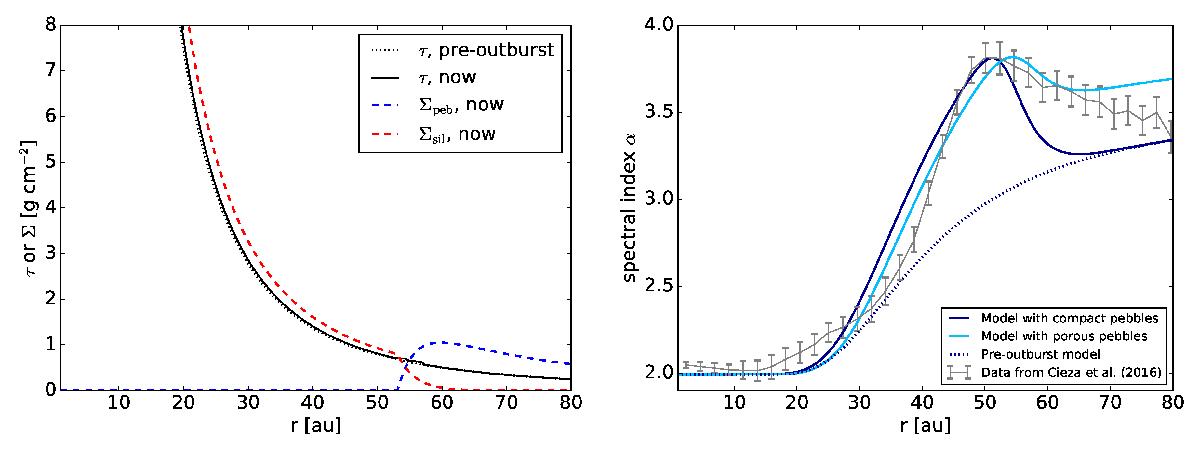
Left: optical depth τ and surface density profiles Σ as a function of distance from the star for compact pebbles. Right: spectral index as a function of distance from the star for our benchmark model with compact pebbles of initial size 0.5 cm pre-outburst (dotted dark blue line) and post-outburst (solid dark blue line), and for our post-outburst model with porous pebbles of packing fraction 0.1 and initial size 5.0 cm (light blue line). The gray line with error bars corresponds to the data from Cieza et al. (2016).
Current usage metrics show cumulative count of Article Views (full-text article views including HTML views, PDF and ePub downloads, according to the available data) and Abstracts Views on Vision4Press platform.
Data correspond to usage on the plateform after 2015. The current usage metrics is available 48-96 hours after online publication and is updated daily on week days.
Initial download of the metrics may take a while.