Fig. 1
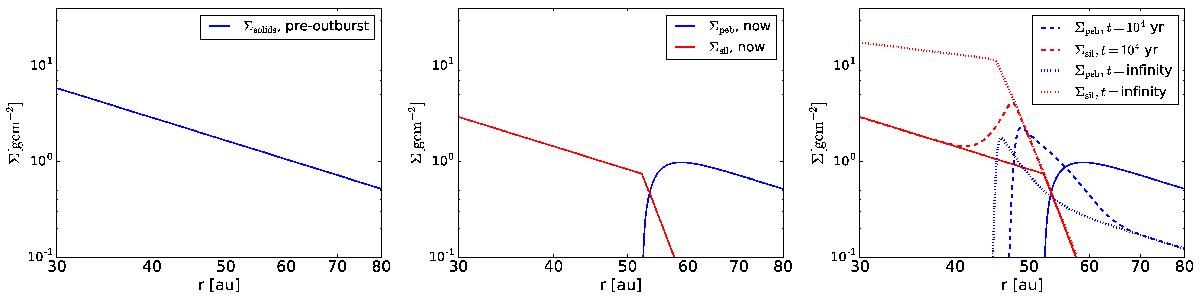
Solids surface density profiles Σ in the V883 Ori disk at three different points in time. Left: before the outburst, the snow line was located at around 2 au. In the domain plotted above the drifting pebbles consist of ices and silicates. Middle: during the outburst, the snow line has moved to ~50 au, exterior to which the pebbles still contain water ice and silicates. The surface density profile of icy pebbles is given by the blue line. Interior to ~50 au the pebbles have disintegrated and smaller silicate particles remain (red line). We expect that the V883 Ori disk is presently in this state. Right: assuming that the disk temperature remains at Tpost after the outburst, eventually a pileup of silicate particles interior to the snow line (red lines) is realized owing to their smaller drift velocity. There is also a pileup in the icy pebble surface density distribution (blue lines) owing to outward diffusion and re-condensation (Schoonenberg & Ormel 2017). The dashed lines correspond to the situation after 104 yr and the dotted lines correspond to the steady-state solution. The solid lines are the same as in the middle panel. Since the typical decay timescale of an FU Ori outburst is ~100 yr, we do not expect to reach either of these states.
Current usage metrics show cumulative count of Article Views (full-text article views including HTML views, PDF and ePub downloads, according to the available data) and Abstracts Views on Vision4Press platform.
Data correspond to usage on the plateform after 2015. The current usage metrics is available 48-96 hours after online publication and is updated daily on week days.
Initial download of the metrics may take a while.