Fig. 3
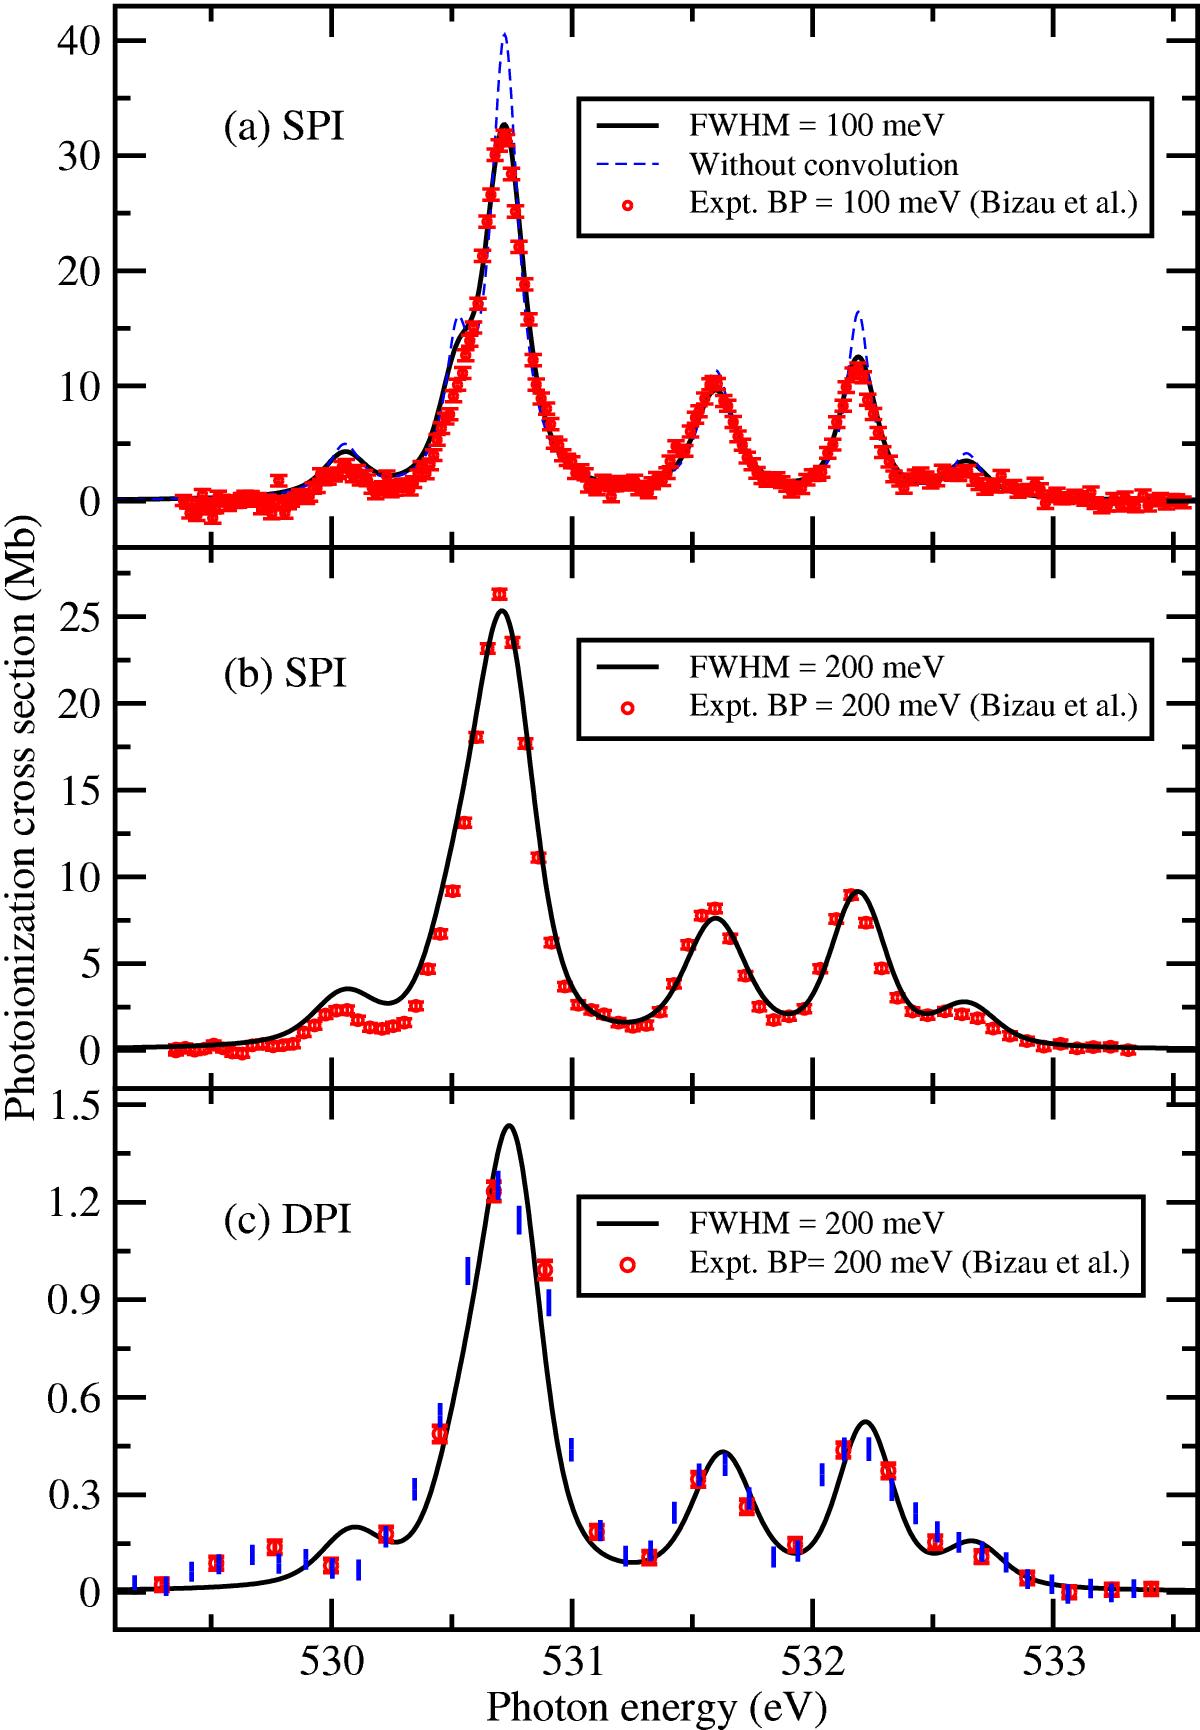
Comparison of theoretical and experimental (Bizau et al. 2015) single photoionization (SPI) and double photoionization (DPI) cross sections of O+. a) SPI cross section compared with the relative measurement of 100 meV BP, b) SPI cross section compared with the absolute measurement of 200 meV BP, and c) DPI cross section compared with the absolute measurement (red open circles) and relative measurement (blue vertical bars) with 200 meV BP. The vertical bars indicate the statistical uncertainties of the experiment. The theoretical cross sections were reconstructed assuming a relative population fraction of 47% for 1s22s22p3![]() , 31% for
, 31% for ![]() , and 22% for
, and 22% for ![]() , and then convolved with a Gaussian profile with full width at half maximum (FWHM) of respective experimental BP. To have the best comparison with the experiment, the theoretical resonance positions have been shifted to the lower energy direction according to the measured values by 1.042 eV for
, and then convolved with a Gaussian profile with full width at half maximum (FWHM) of respective experimental BP. To have the best comparison with the experiment, the theoretical resonance positions have been shifted to the lower energy direction according to the measured values by 1.042 eV for ![]() –2D, 0.919 eV for
–2D, 0.919 eV for ![]() –2P, 1.373 eV for
–2P, 1.373 eV for ![]() –4P, 1.203 eV for
–4P, 1.203 eV for ![]() –2D, 0.995 eV for
–2D, 0.995 eV for ![]() –2P and 1.315 eV for
–2P and 1.315 eV for ![]() –2S, respectively.
–2S, respectively.
Current usage metrics show cumulative count of Article Views (full-text article views including HTML views, PDF and ePub downloads, according to the available data) and Abstracts Views on Vision4Press platform.
Data correspond to usage on the plateform after 2015. The current usage metrics is available 48-96 hours after online publication and is updated daily on week days.
Initial download of the metrics may take a while.