Free Access
Fig. 1
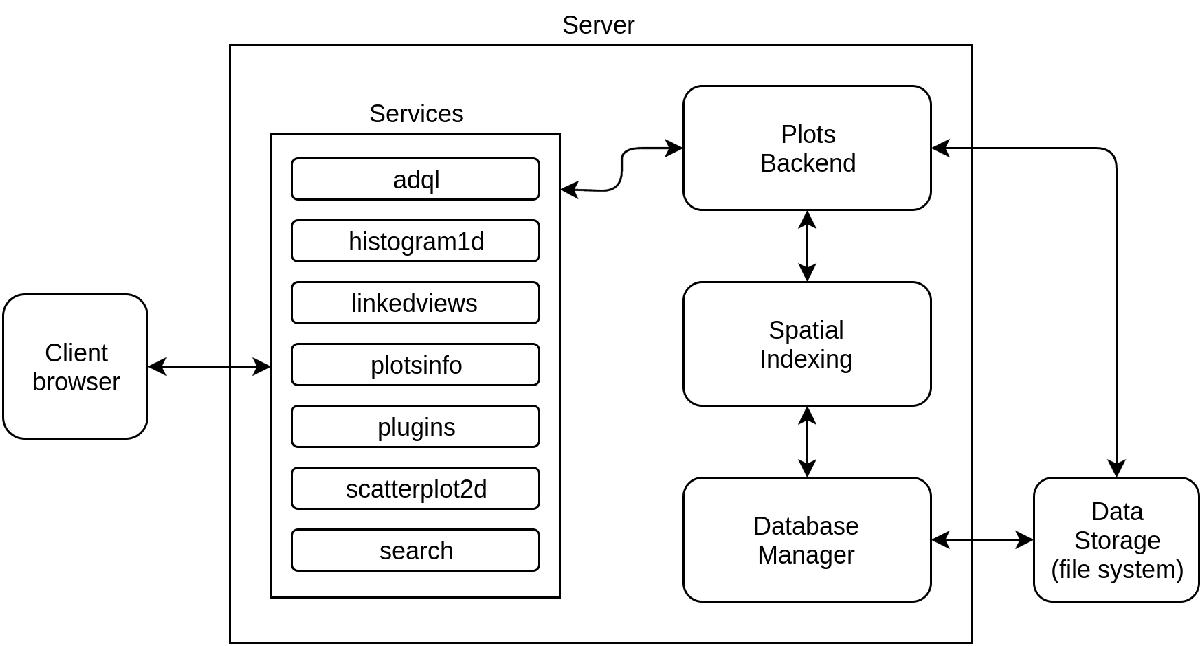
Static architecture diagram for the GAVS Server. It presents the components of the Server (Services, Plots Backend, Spatial Indexing, and Database Manager), how they are connected, and the context within the GAVS.
Current usage metrics show cumulative count of Article Views (full-text article views including HTML views, PDF and ePub downloads, according to the available data) and Abstracts Views on Vision4Press platform.
Data correspond to usage on the plateform after 2015. The current usage metrics is available 48-96 hours after online publication and is updated daily on week days.
Initial download of the metrics may take a while.