Fig. 10
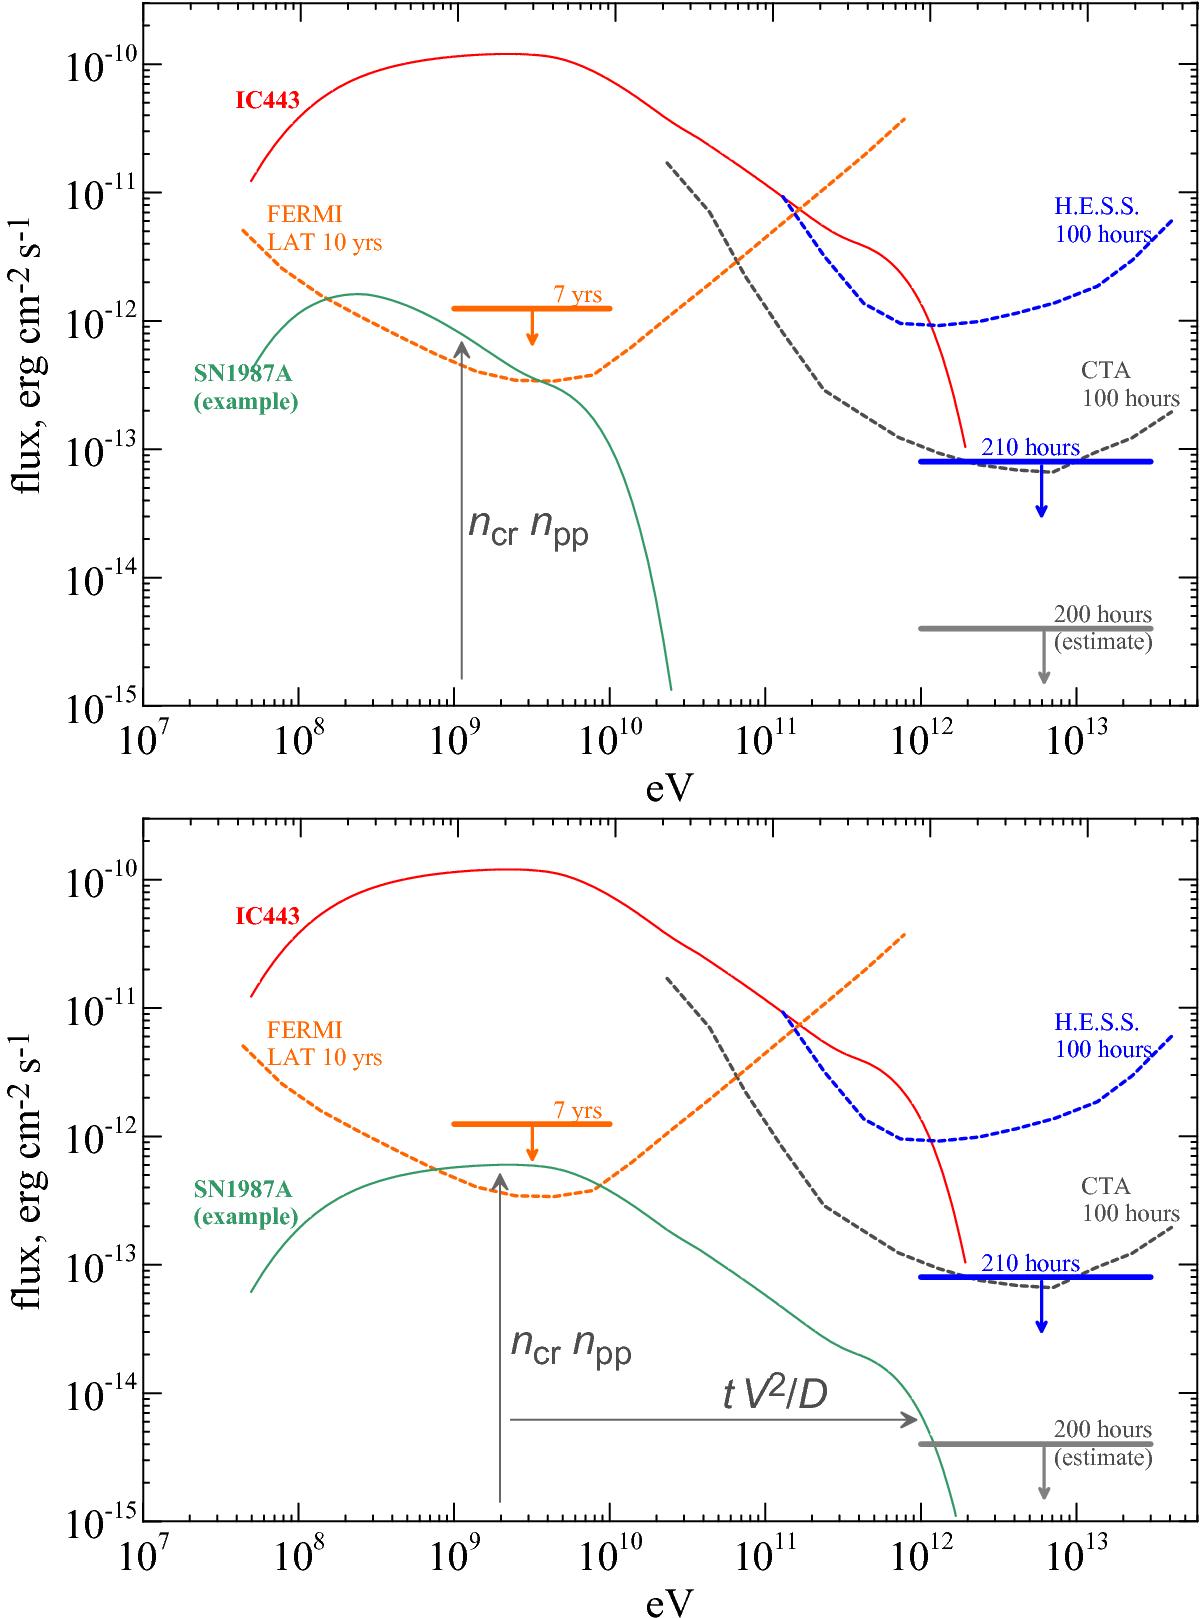
Hadronic γ-ray spectrum of SN1987A (green line). Also shown are: instrument sensitivities (Funk & Hinton 2013), the upper limits on the γ-ray flux after 7 yr of Fermi observations (orange, Ackermann et al. 2016) and after 210 h of HESS observations (blue, H.E.S.S. Collaboration 2015). The estimate of the upper limit for observations by CTA (grey) is obtained by scaling of the HESS upper limit. The spectrum of IC 443 (red line from Fig. 9) is also shown for comparison. The upper and lower plots correspond to the γ-ray spectrum of SN1987A in the cases A and B described in the text.
Current usage metrics show cumulative count of Article Views (full-text article views including HTML views, PDF and ePub downloads, according to the available data) and Abstracts Views on Vision4Press platform.
Data correspond to usage on the plateform after 2015. The current usage metrics is available 48-96 hours after online publication and is updated daily on week days.
Initial download of the metrics may take a while.