Fig. 5
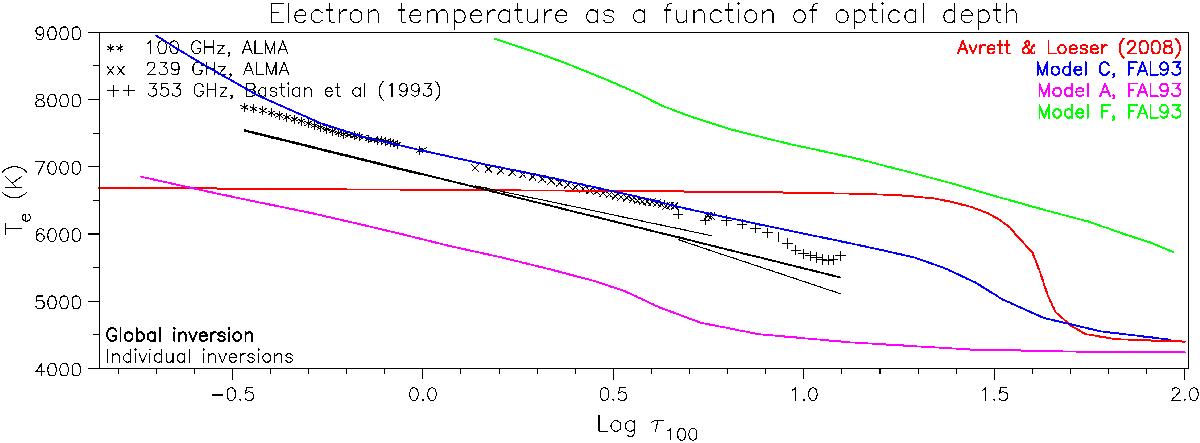
Electron temperature as a function of the optical depth at 100 GHz. The thick black line is the result of our inversion of the CLV curves of Fig. 4, together with the data of Bastian et al. (1993). Thin black lines are inversions of individual wavelength bands. The symbols denote the Eddington-Barbier solution of the transfer equation. The full lines in color were computed from the models of Fontenla et al. (1993; FAL93) and Avrett & Loeser (2008).
Current usage metrics show cumulative count of Article Views (full-text article views including HTML views, PDF and ePub downloads, according to the available data) and Abstracts Views on Vision4Press platform.
Data correspond to usage on the plateform after 2015. The current usage metrics is available 48-96 hours after online publication and is updated daily on week days.
Initial download of the metrics may take a while.