Free Access
Fig. 4
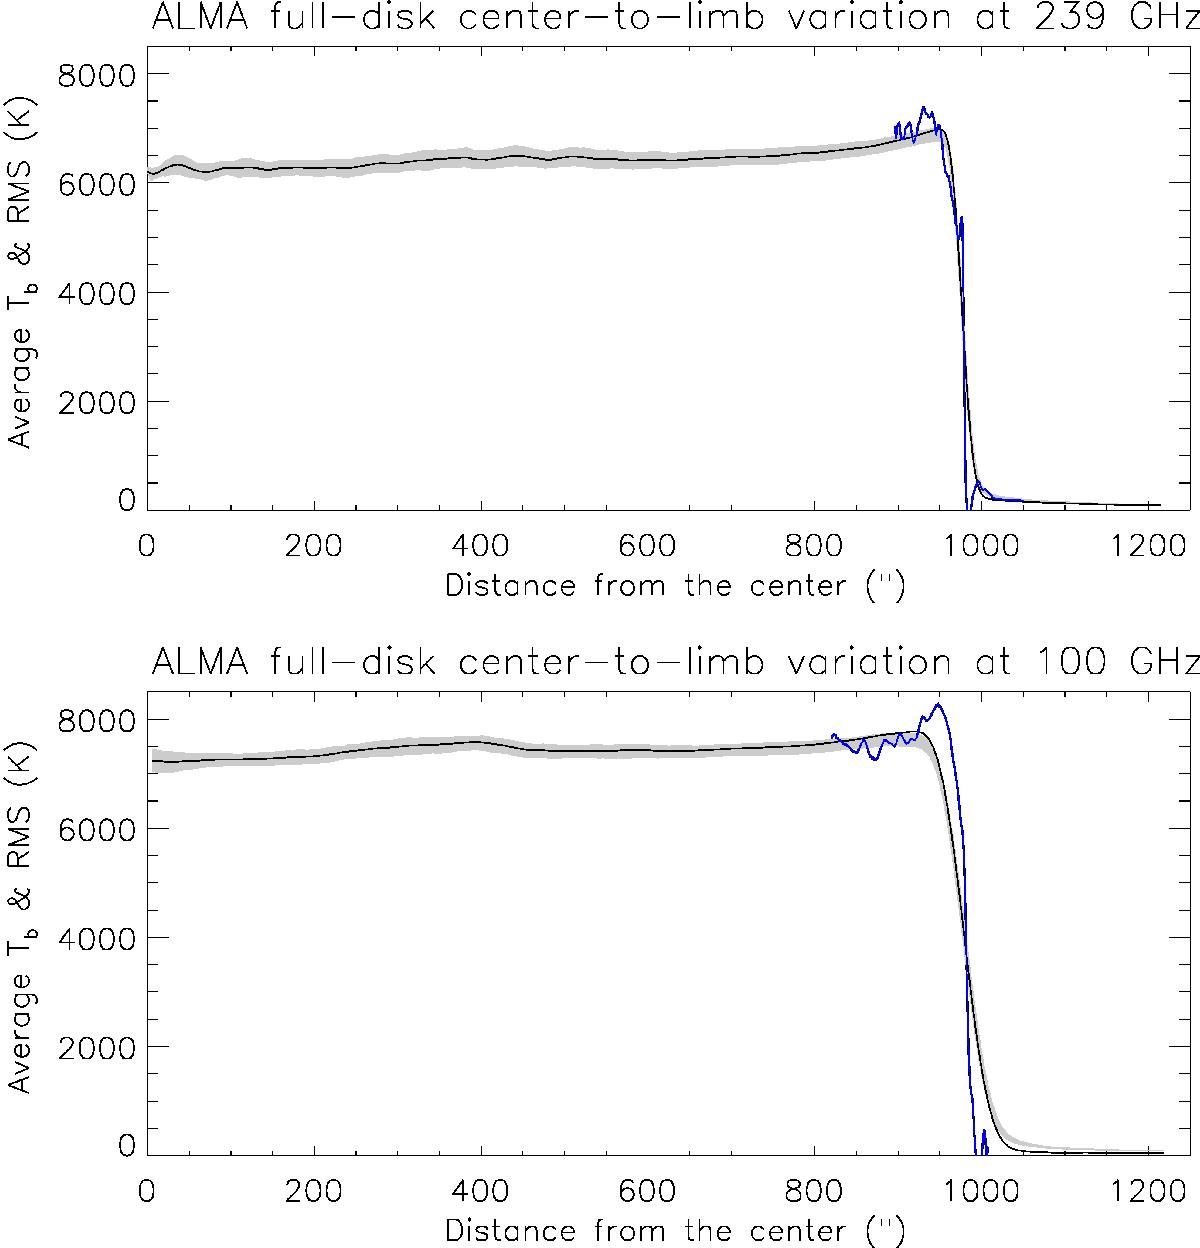
Center-to-limb variation (CLV) for 239 and 100 GHz. The gray band shows the measured values ± the corresponding rms. The superposed blue curves near the limb are from high resolution ALMA images. Curves in black show the CLV after correction for diffuse light.
Current usage metrics show cumulative count of Article Views (full-text article views including HTML views, PDF and ePub downloads, according to the available data) and Abstracts Views on Vision4Press platform.
Data correspond to usage on the plateform after 2015. The current usage metrics is available 48-96 hours after online publication and is updated daily on week days.
Initial download of the metrics may take a while.