Free Access
Fig. 2
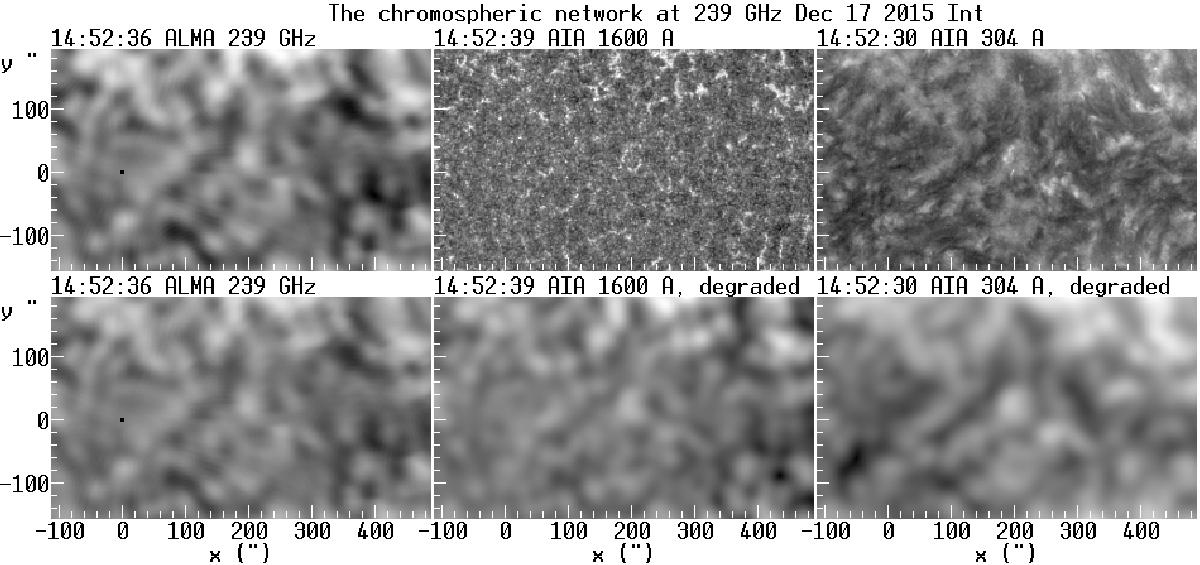
Images of the chromospheric network near disk center from the ALMA FD image of December 17, 2015 at 239 GHz, together with 1600 Å and 304 Å AIA images. In the bottom row the AIA images were degraded to the ALMA resolution.
Current usage metrics show cumulative count of Article Views (full-text article views including HTML views, PDF and ePub downloads, according to the available data) and Abstracts Views on Vision4Press platform.
Data correspond to usage on the plateform after 2015. The current usage metrics is available 48-96 hours after online publication and is updated daily on week days.
Initial download of the metrics may take a while.