Fig. 1
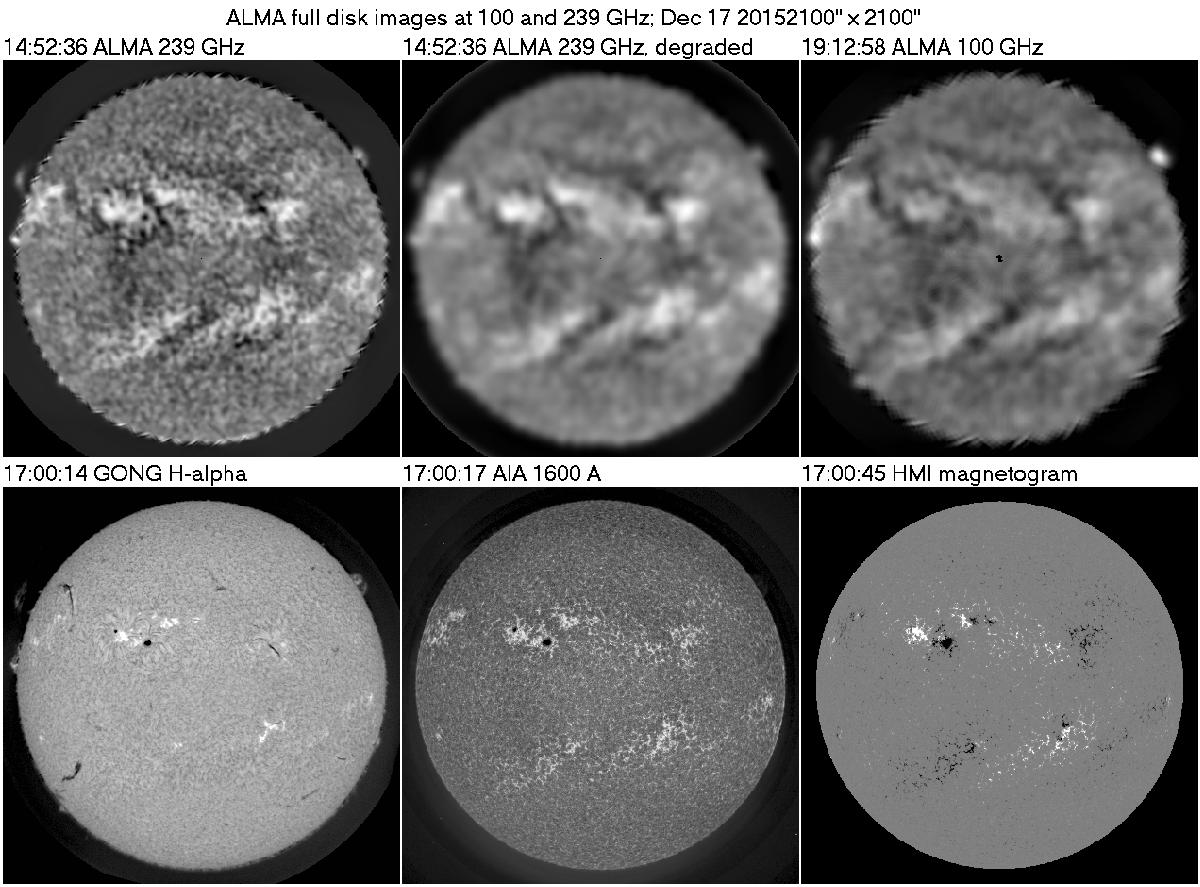
ALMA full disk images on December 17, 2015, compared with images at other wavelengths. Top row, left to right: ALMA image at 239 GHz; the same, degraded to the 100 GHz resolution; and ALMA image at 100 GHz. Bottom row: Hα from the GONG network; 1600 Å image from AIA/SDO; and magnetogram from HMI/SDO. The images have been partly corrected for center-to-limb variation. ALMA images are shown with the same contrast.
Current usage metrics show cumulative count of Article Views (full-text article views including HTML views, PDF and ePub downloads, according to the available data) and Abstracts Views on Vision4Press platform.
Data correspond to usage on the plateform after 2015. The current usage metrics is available 48-96 hours after online publication and is updated daily on week days.
Initial download of the metrics may take a while.