Free Access
Fig. 6
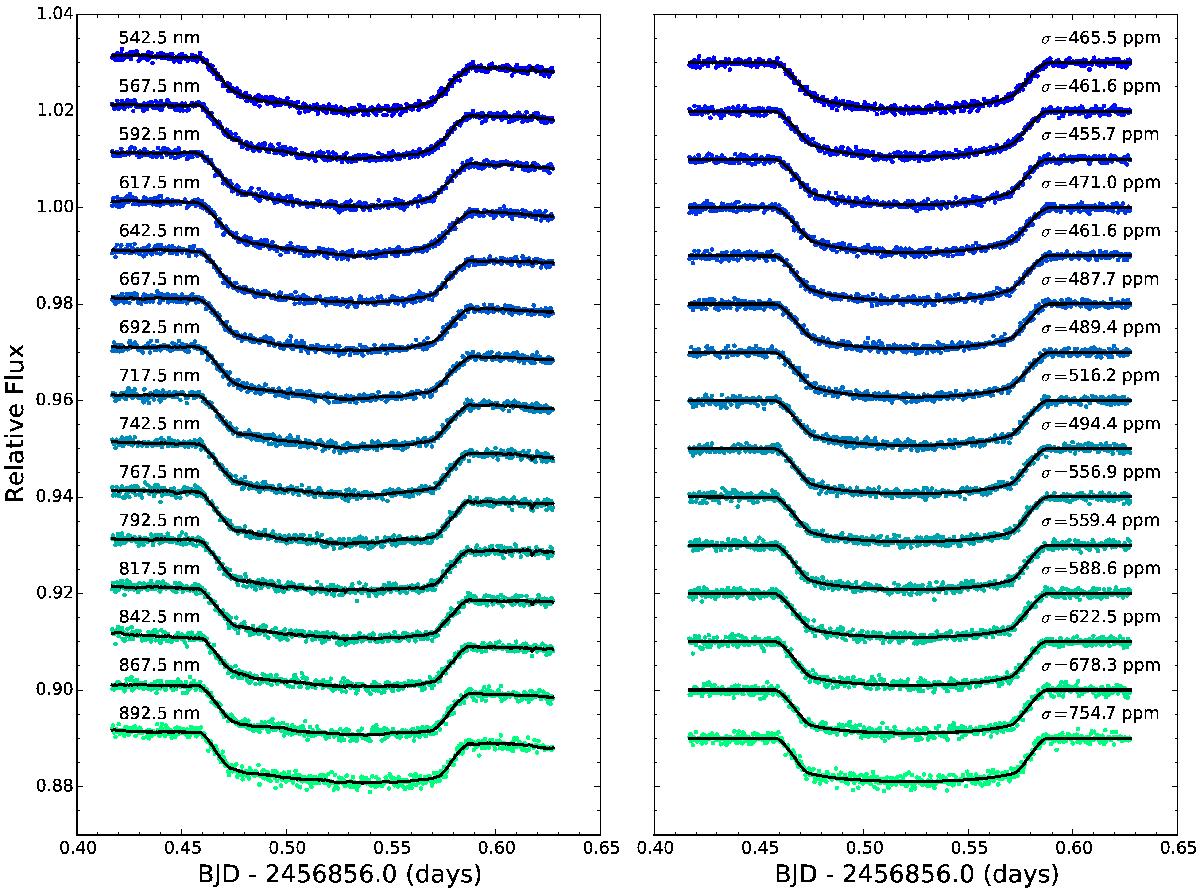
Light curves obtained using the filters of 25 nm of width for WASP48-b. Left panel: observed light curves and best fit (black line). Right panel: transit light curves after removing systematic effects and best fit (black line).
Current usage metrics show cumulative count of Article Views (full-text article views including HTML views, PDF and ePub downloads, according to the available data) and Abstracts Views on Vision4Press platform.
Data correspond to usage on the plateform after 2015. The current usage metrics is available 48-96 hours after online publication and is updated daily on week days.
Initial download of the metrics may take a while.