Fig. 5
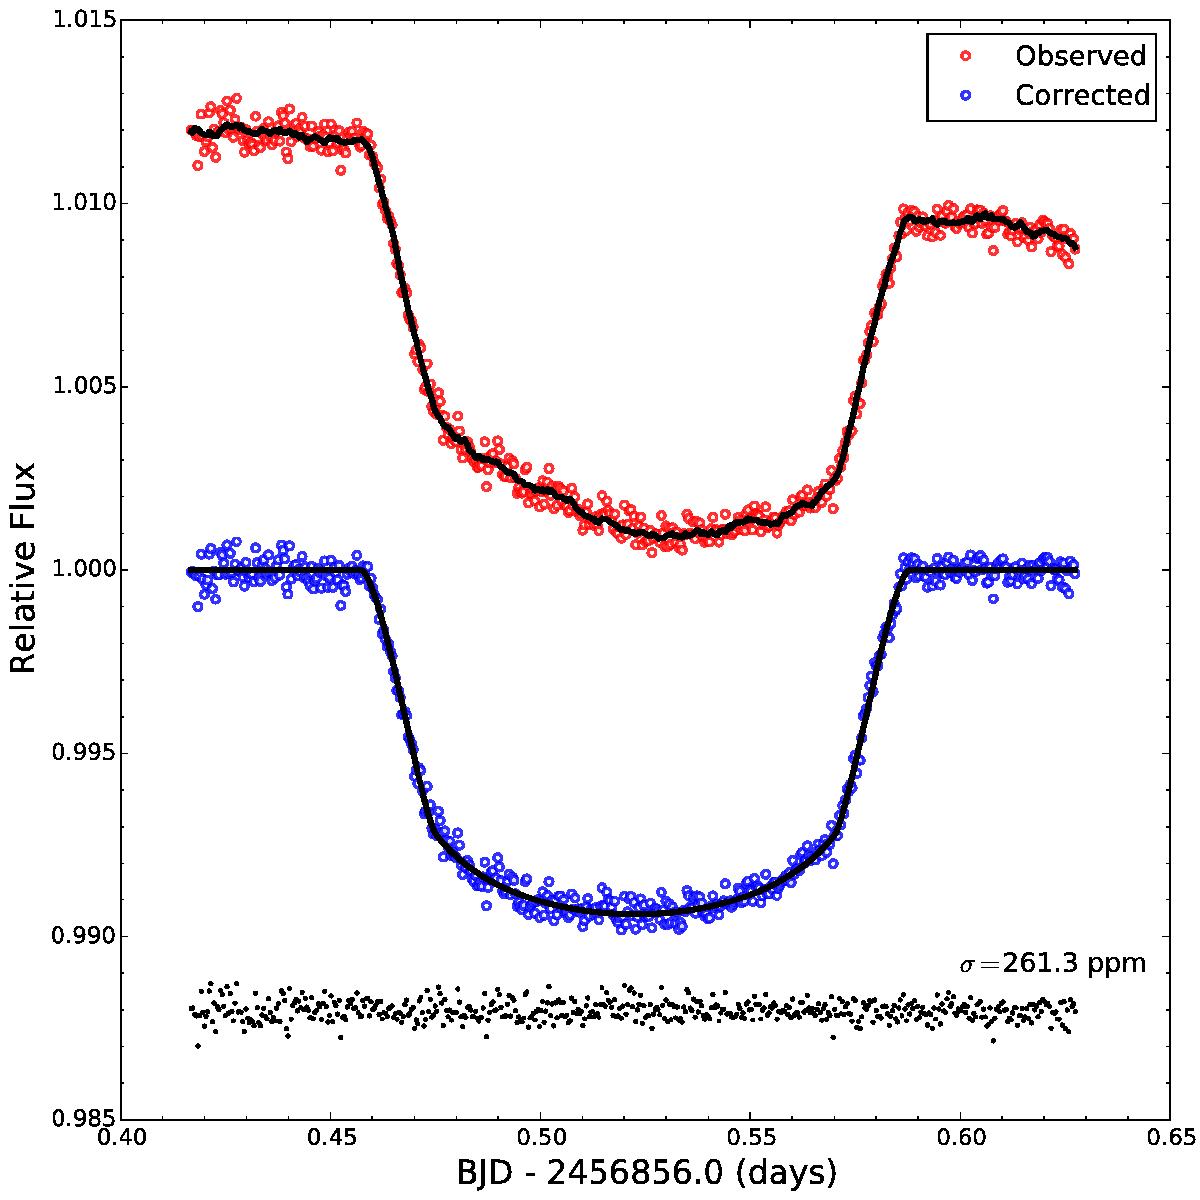
GTC/OSIRIS WASP-48b white light transit curve. The red points present the observed time series and the blue points show the light curve after removing the systematic effects and red noise component. The black line represents the best fit determined using our MCMC analysis. The black dots at the bottom are the residuals of the best fit with an arbitrary offset.
Current usage metrics show cumulative count of Article Views (full-text article views including HTML views, PDF and ePub downloads, according to the available data) and Abstracts Views on Vision4Press platform.
Data correspond to usage on the plateform after 2015. The current usage metrics is available 48-96 hours after online publication and is updated daily on week days.
Initial download of the metrics may take a while.