Free Access
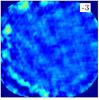
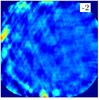
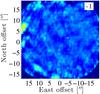
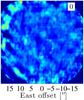
Fig. A.2
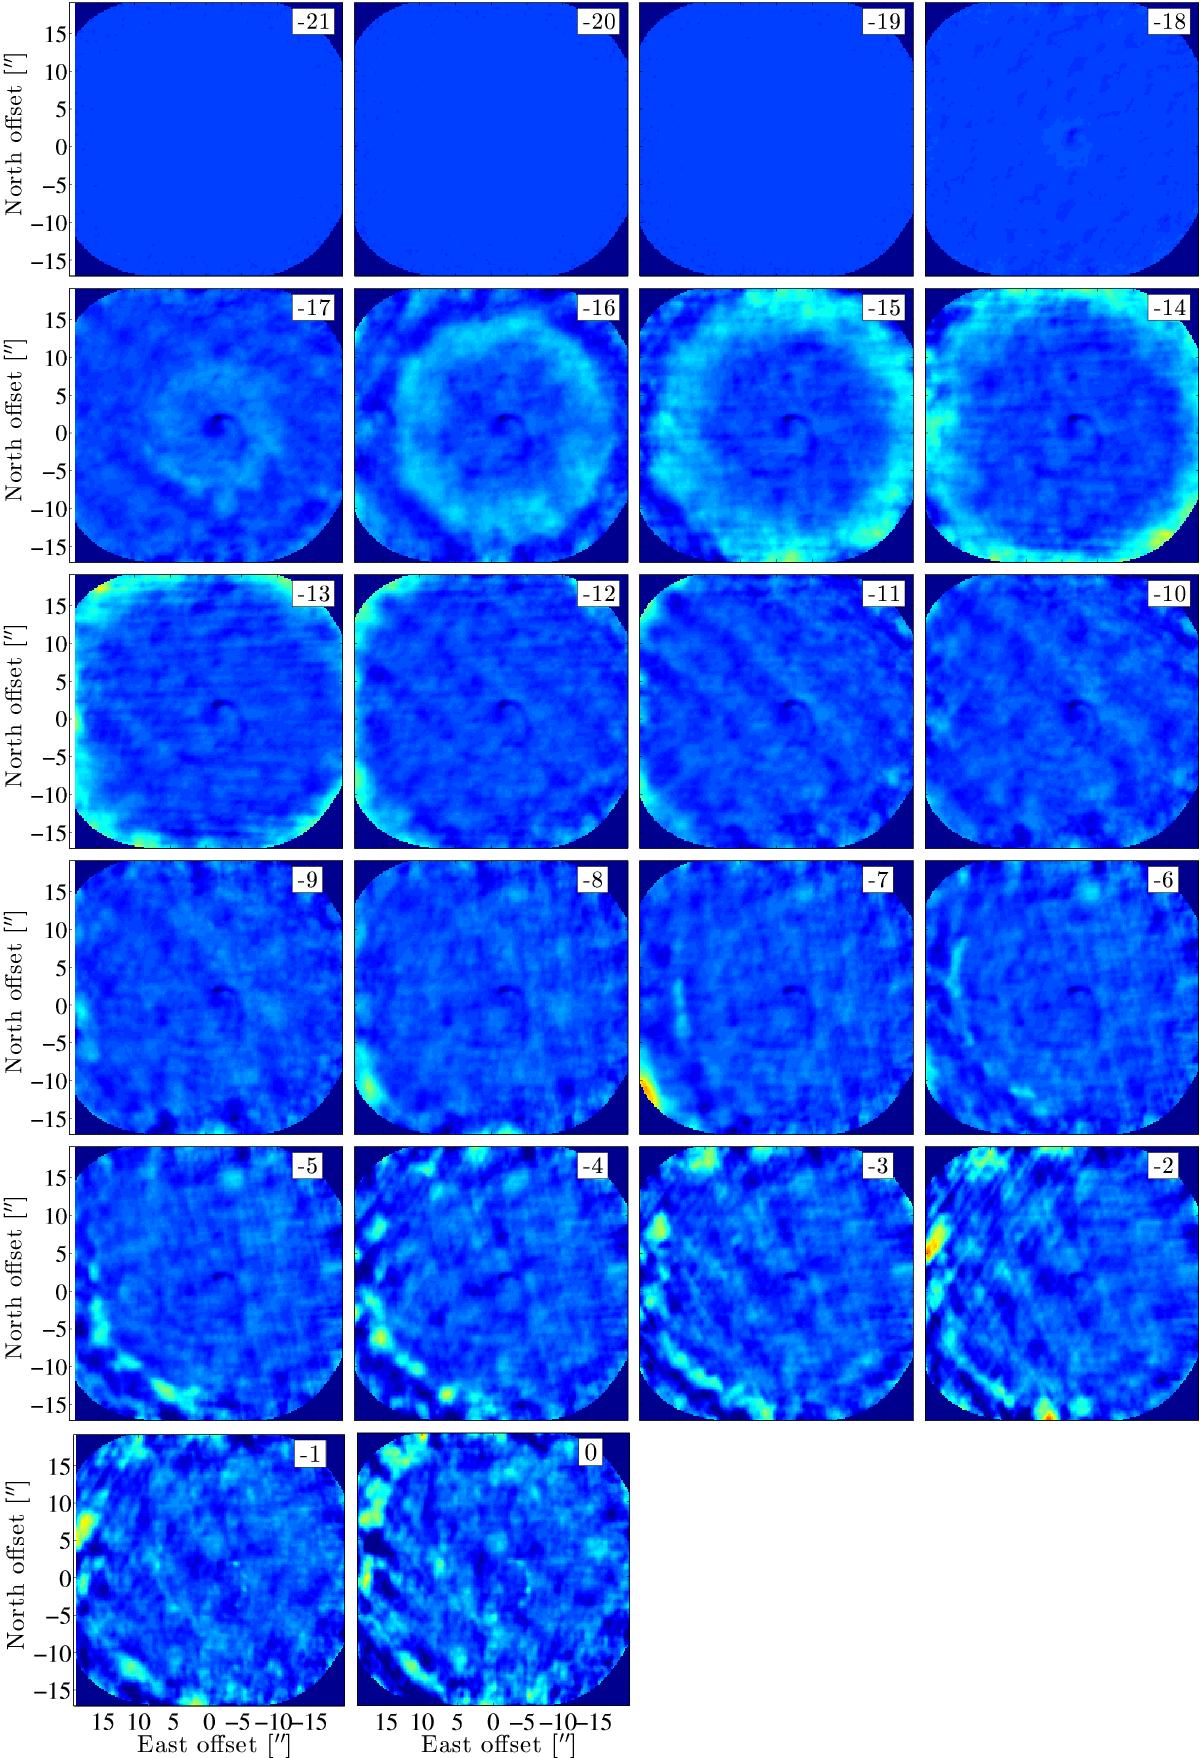
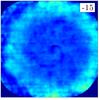
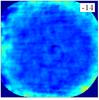
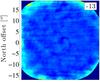
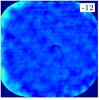
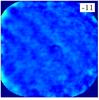
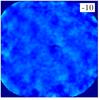
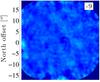
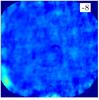
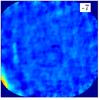
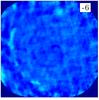
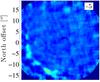
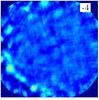
Channel maps from the model with e = 0.2 (see text for explanation). The velocity relative to the line centre of each channel is given in the upper right corner legend. Only the blue-shifted emission is shown since the maps are completely symmetric around the line centre.
This figure is made of several images, please see below:


Current usage metrics show cumulative count of Article Views (full-text article views including HTML views, PDF and ePub downloads, according to the available data) and Abstracts Views on Vision4Press platform.
Data correspond to usage on the plateform after 2015. The current usage metrics is available 48-96 hours after online publication and is updated daily on week days.
Initial download of the metrics may take a while.