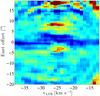
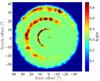
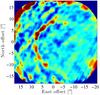
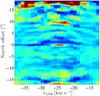
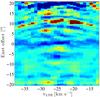
Fig. 4
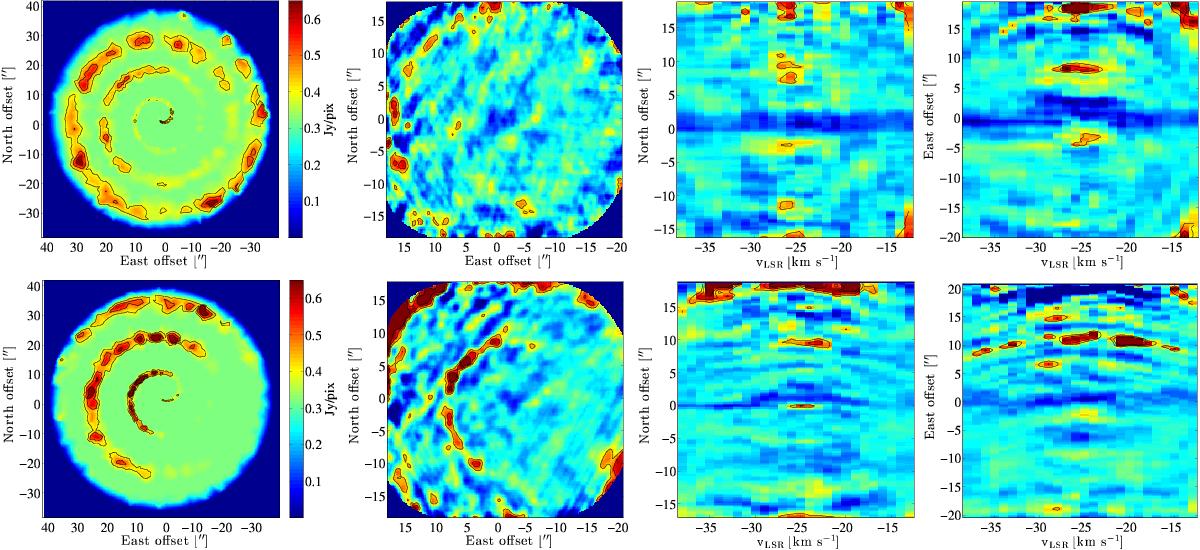
Results from the radiative transfer modelling of the two hydrodynamical models with different orbital eccentricities. The upper row shows the results from the e = 0.2 model. The lower row shows the results from the e = 0.6 model. The far left image shows the output of the full model over the central channels (analogous to Fig. 1) without taking the response of the interferometer into account. The middle left image shows the output from the ALMA simulator. The two right images show PV-diagrams generated perpendicular to the model binary axis (PA = 0°) and along it (PA = 90°), respectively. The contours are drawn at 35, 50, 75%-fractions of the peak emission.
Current usage metrics show cumulative count of Article Views (full-text article views including HTML views, PDF and ePub downloads, according to the available data) and Abstracts Views on Vision4Press platform.
Data correspond to usage on the plateform after 2015. The current usage metrics is available 48-96 hours after online publication and is updated daily on week days.
Initial download of the metrics may take a while.